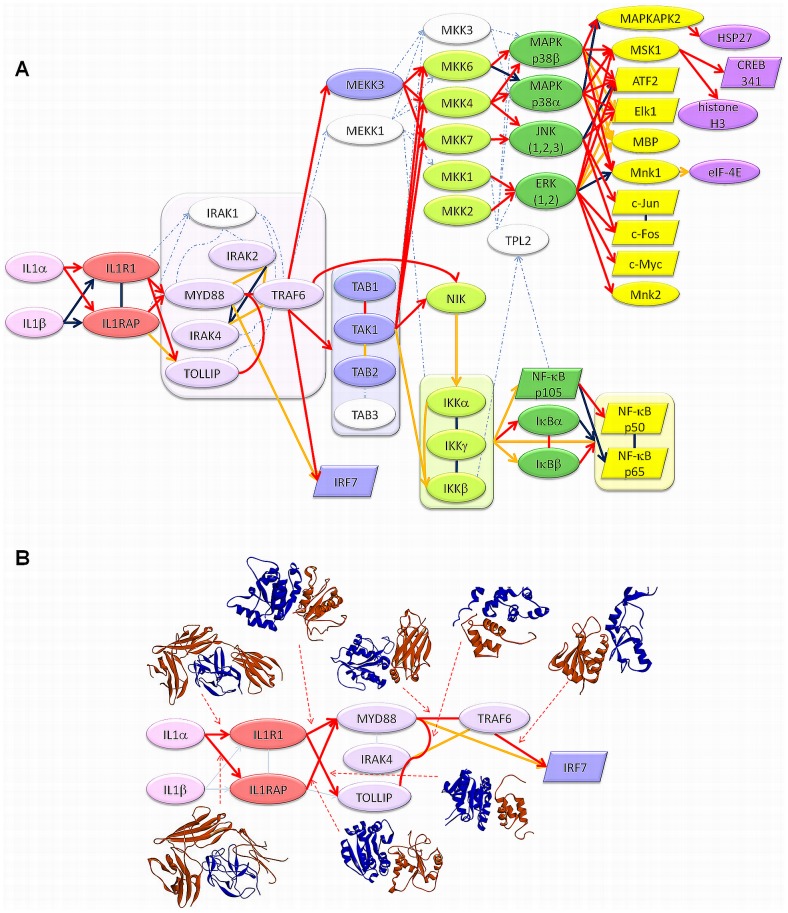
Figure 3. Structures of protein-protein complexes mapped to the IL-1 signaling pathway.
A. Overall distribution of experimental and predicted complexes on the pathway. Dark blue interactions represent the experimentally determined complex structures in the PDB, red interactions represent the predicted complexes with predicted binding energies lower than −10 energy units and yellow interactions represent the interactions for which neither experimental nor computational data exists. B. Predicted structures (Template PDB code+Target PDB codes+Energy value): IL1α-IL1R1 (1itbAB 2l5x 4depB −71.92); IL1α-IL1RAP (1itbAB 2l5x 4depC −49.25); IL1R1-MYD88 (1gylAB IL1R1 (model) 2z5v −23.8); IL1R1-TOLLIP (1oh0AB IL1R1 (model) 1wgl −18.85); IL1RAP-MYD88 (1p65AB IL1RAP (model) 2z5v −31.72); MYD88-TOLLIP (1yrlAC 3mopA 1wgl −11.04); MYD88-TRAF6 (1vjlAB 2js7 1lb6 −37.01); TRAF6-IRF7 (1g8tAB 2o61 3hct −25.83). The blue color represents the proteins that precede its partners in the information flow.

