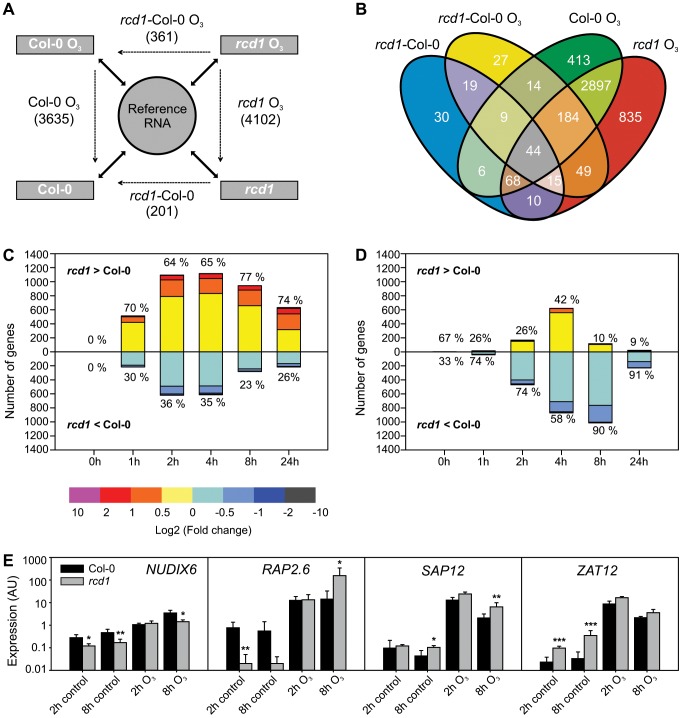
Figure 1. Gene expression of Col-0 and rcd1 mutant in clean air and O3-treated plants.
A) Experimental design with each sample hybridized against a reference RNA (solid arrows) enables multidirectional comparisons between genotypes and treatments with a linear mixed model (dotted arrows). The experiment described was repeated at each time point (0, 1, 2, 4, 8 and 24 h) and lists of differentially expressed transcripts (log2 ratio ±1, q<0.05) were made from each comparison. Number of differentially expressed unique genes at all time points is shown. The 0 h comparison of O3-treated rcd1 and O3-treated Col-0 was analyzed together with rcd1 and Col-0 grown in clean air to comprise the list of genes differentially regulated in rcd1 in normal growth conditions (rcd1-Col-0). Simultaneously, this 0 h comparison was omitted from the rcd1-Col-0 O3 data set. B) Venn diagram showing the overlap of gene lists. Transcripts at least two-fold differentially regulated between rcd1 and Col-0 in response to apoplastic ROS are divided into several subcategories discussed in the results. C, D) Transcript levels of 4544 genes responsive to O3-treatment (log2 ratio ±1, q<0.05) in one or both of the genotypes were compared. Genes were divided into O3-induced (C) and O3-repressed (D) according to the O3-response specifically at each time point (0, 1, 2, 4, 8 and 24 h). For each gene the difference between O3-treated rcd1 and Col-0 was calculated (log2 ratio) and the number of genes in each range of differential expression (depicted in color) is shown on the y-axis. The percentage of genes with higher (rcd1>Col-0) and lower (rcd1<Col-0) expression in rcd1 compared to Col-0 was calculated. E) Expression of selected marker genes was studied in Col-0 and rcd1 plants with qPCR. Bars represent means of three biological repeats, error bars show standard deviation. Statistically significant difference between genotypes is depicted with asterisk (P<0.05:*; P<0.01:** and P<0.001:***).

