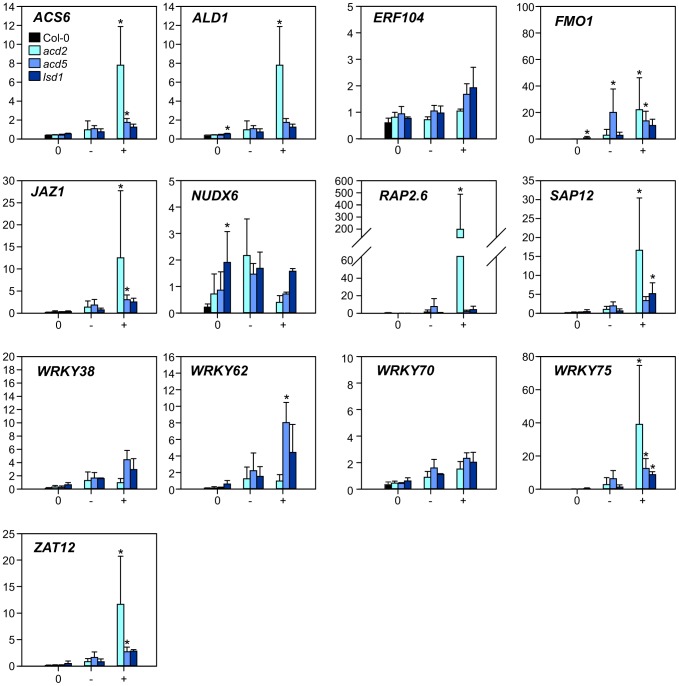
Figure 3. Expression of selected marker genes in lesion mimic mutants.
Samples from three lesion mimic genotypes (acd2, acd5 and lsd1) 3 d after the transfer to LD were classified as samples from plants with no lesions (labelled 0); leaves with no lesions from plants with lesions (labelled −); leaves with lesions (labelled +). Averages of qPCR results (arbitrary units) from three biological replicates are shown; error bars depict standard deviation. Asterisks depict statistical significance (P<0.05) between to Col-0 (within 0 samples) or to 0 samples within the respective genotype (− and + samples).

