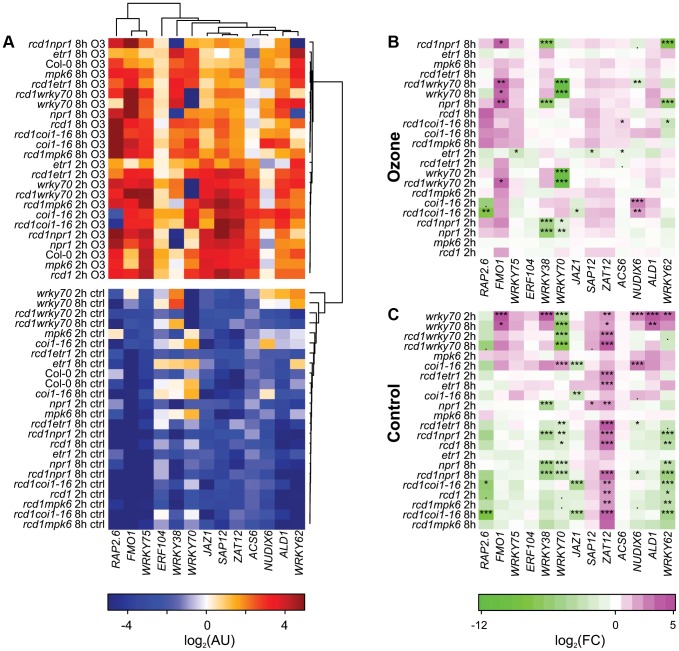
Figure 4. Cluster analysis of gene expression in clean air and O3-treated plants.
Three-week-old plants were treated with 6 h of O3 (350 nL L−1) and samples harvested at 2 and 8 h after the start of the O3 exposure. Expression of selected marker genes in each genotype was studied with qPCR and bootstrapped Bayesian hierarchical clustering was applied to log2-transformed expression values in arbitrary units (A). Gene expression in mutant genotypes was compared to the respective Col-0 sample at each time point (2 h, 8 h) and log2-transformed fold changes were calculated for O3 treatment (B) and control plants (C). Asterisks mark statistical significance according to the linear model (P<0.10:“.”; P<0.05:“*”; P<0.01:“**”; P<0.001:“***”.).

