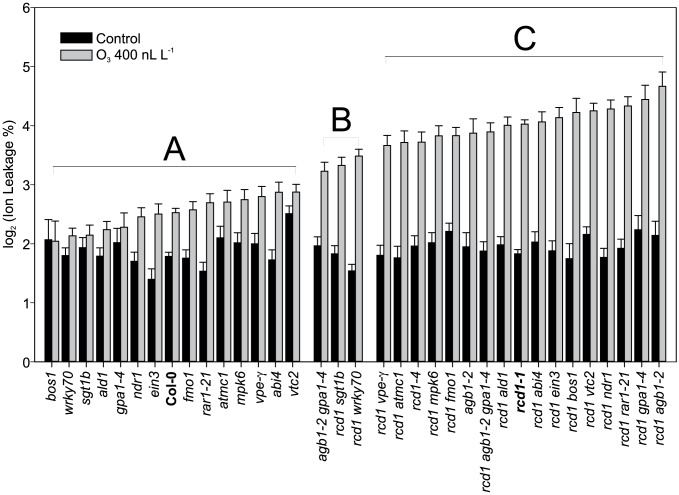
Figure 5. Quantification of O3 -induced cell death in Col-0, rcd1 and various double mutants.
Plants were exposed to 63 (400 nL L−1) and after 2 h recovery in the clean air, they were harvested for ion leakage measurements. Samples of untreated plants grown in clean air were simultaneously collected. Samples are ranked according to their ion leakage in O3. Ion leakage percentages of O3 samples were compared to O3-treated Col-0 and rcd1-1 with linear models. Ion leakages of samples belonging to groups A and C did not differ from Col-0 and rcd1, respectively. Group B and C samples showed elevated O3-damage compared to Col-0 (P<0.01), whereas samples in groups A and B had decreased O3-damage in comparison to rcd1 (P<0.01). In clean air samples, only vtc2 differed from Col-0 (P<0.001). Bars represent means of two to seven biological repeats with standard error.

