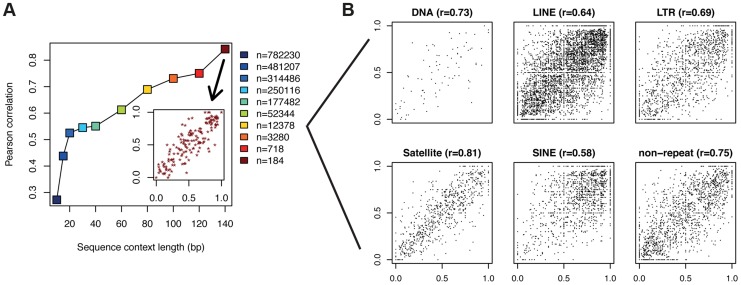
Figure 3. CpGs with identical flanking sequence display similar methylation.
(a) For each CpG in a PMD, the surrounding sequence (CpG in the center) was extracted and used to identify sequences occurring multiple times in the genome. Correlation coefficients for pairs of CpGs with identical flanking sequences are depicted on the y-axis. This procedure was performed for various sequence lengths ranging from 10 bp to 140 bp. The inlet displays the actual data points giving rise to the correlation coefficient at 140 bp. In the case where a sequence occurred more than twice in the genome, only one randomly selected pair was considered. The legend denotes the number of pairs of data points available for each sequence length. (b) Scatter plots of methylation levels for CpG pairs with identical sequence context of length 80 (yellow square in (a)) separated by repeat annotation. Only repeat classes with at least 100 data points are shown.

