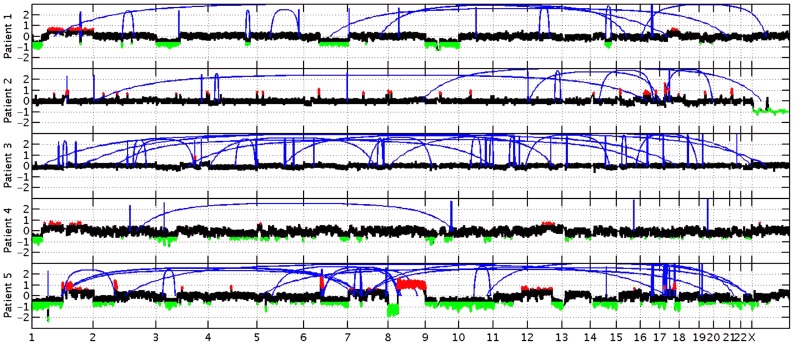
Figure 4. Copy number changes and structural rearrangements.
Whole genome data was utilized to determine copy number alterations and structural rearrangements in the genome for Patients 1–5. WGS was not conducted for patient 6. Red indicates copy number gain, green copy number loss and blue lines indicate structural rearrangements. Significant variability between samples was observed for both copy number changes and structural rearrangements. Patient 5 presented with numerous copy number changes and structural rearrangements contrasting with patient 4 who had minimal structural rearrangements and much smaller regions of copy number changes. Patient 3 is characterized by a large number of structural rearrangements with almost no copy number alterations; in contrast, Patient 1 has a moderate number of structural variations, but has large regions of copy number gain and loss. Patient 2 has a moderate number of structural rearrangements with multiple focal amplifications across the genome.

