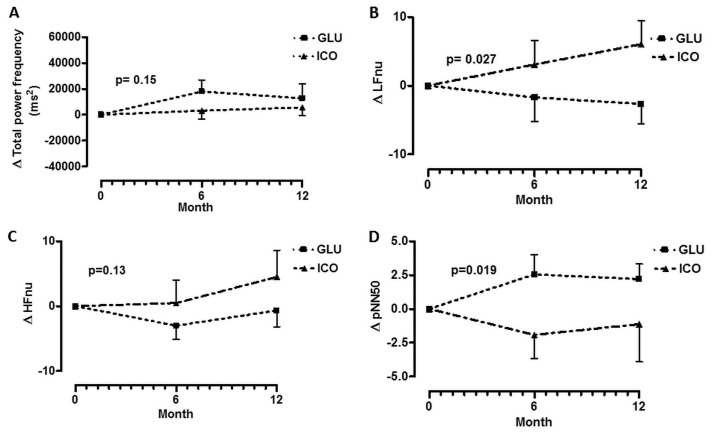
Figure 1 —
Changes (Δ) in parameters of heart rate variability during follow-up. (A) Change in total power frequency. (B) Change in low-frequency normalized units. (C) Change in high-frequency normalized units. (D) Change in pNN50 (percentage of RR intervals with more than 50 ms variation). GLU = patients using glucose dialysate; ICO = patients using icodextrin dialysate.

