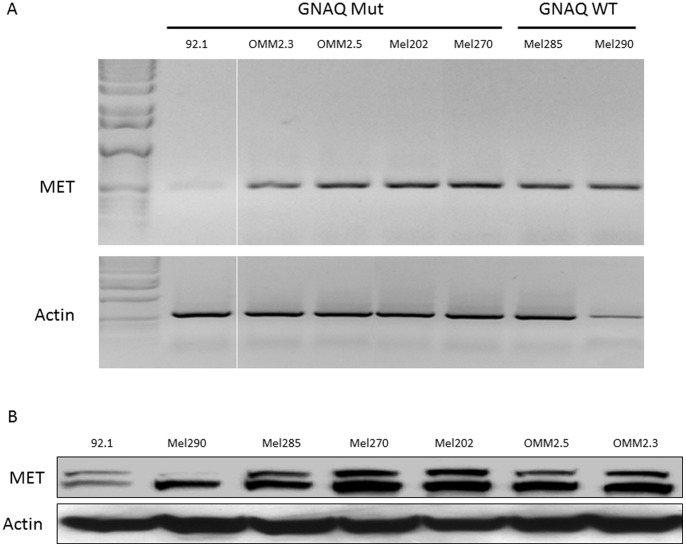
Figure 1. MET mRNA expression levels in GNAQ mutant and wild-type uveal melanoma cells.
(A) MET mRNA expression (top panel) and actin mRNA expression (lower panel) as determined by RT-PCR. Images are from the same gel at the same exposure. (B) MET protein expression levels in GNAQ mutant and wild-type uveal melanoma cells. MET protein expression (top panel) and actin protein expression (lower panel) as determined by western-blot.

