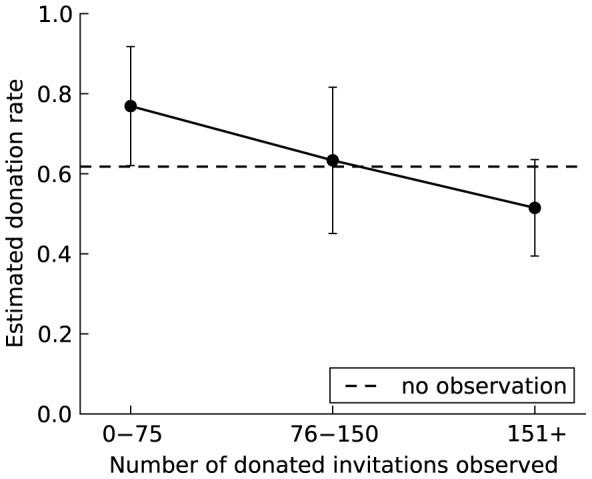
Figure 4. The effect of third-party influence on the willingness to donate among seeds.

To facilitate interpretation of the odds ratios, the figure shows the estimated donation rate and 95% confidence intervals based on a random-intercept linear regression model with robust standard errors corresponding to the random-intercept logistic model in Table 1B. The robust standard errors adjust for possible heteroskedasticity with a binary dependent measure. The dashed line shows the baseline donation rate among seeds in the no-observation condition. The donation rate is significantly higher after observing 0–75 donations by other group members but then declines as the level of observed donation increases further. However, the decline is within the confidence intervals of the estimated donation rates, consistent with the results in Table 1C (in which the donation rates are compared across levels of observed donation).
