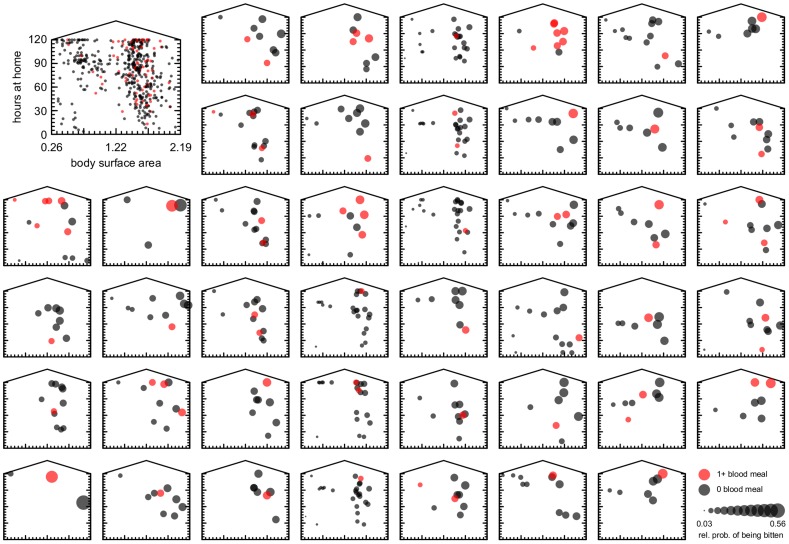
Figure 3. Joint distributions of reported total weekly time in house and body surface area in the 43 house-interview pairs in which there were positive blood meal identifications.
Dot size is proportional to each individual's relative probability of being bitten (eq. 3), and red dots indicate individuals whose blood was identified in mosquitoes.

