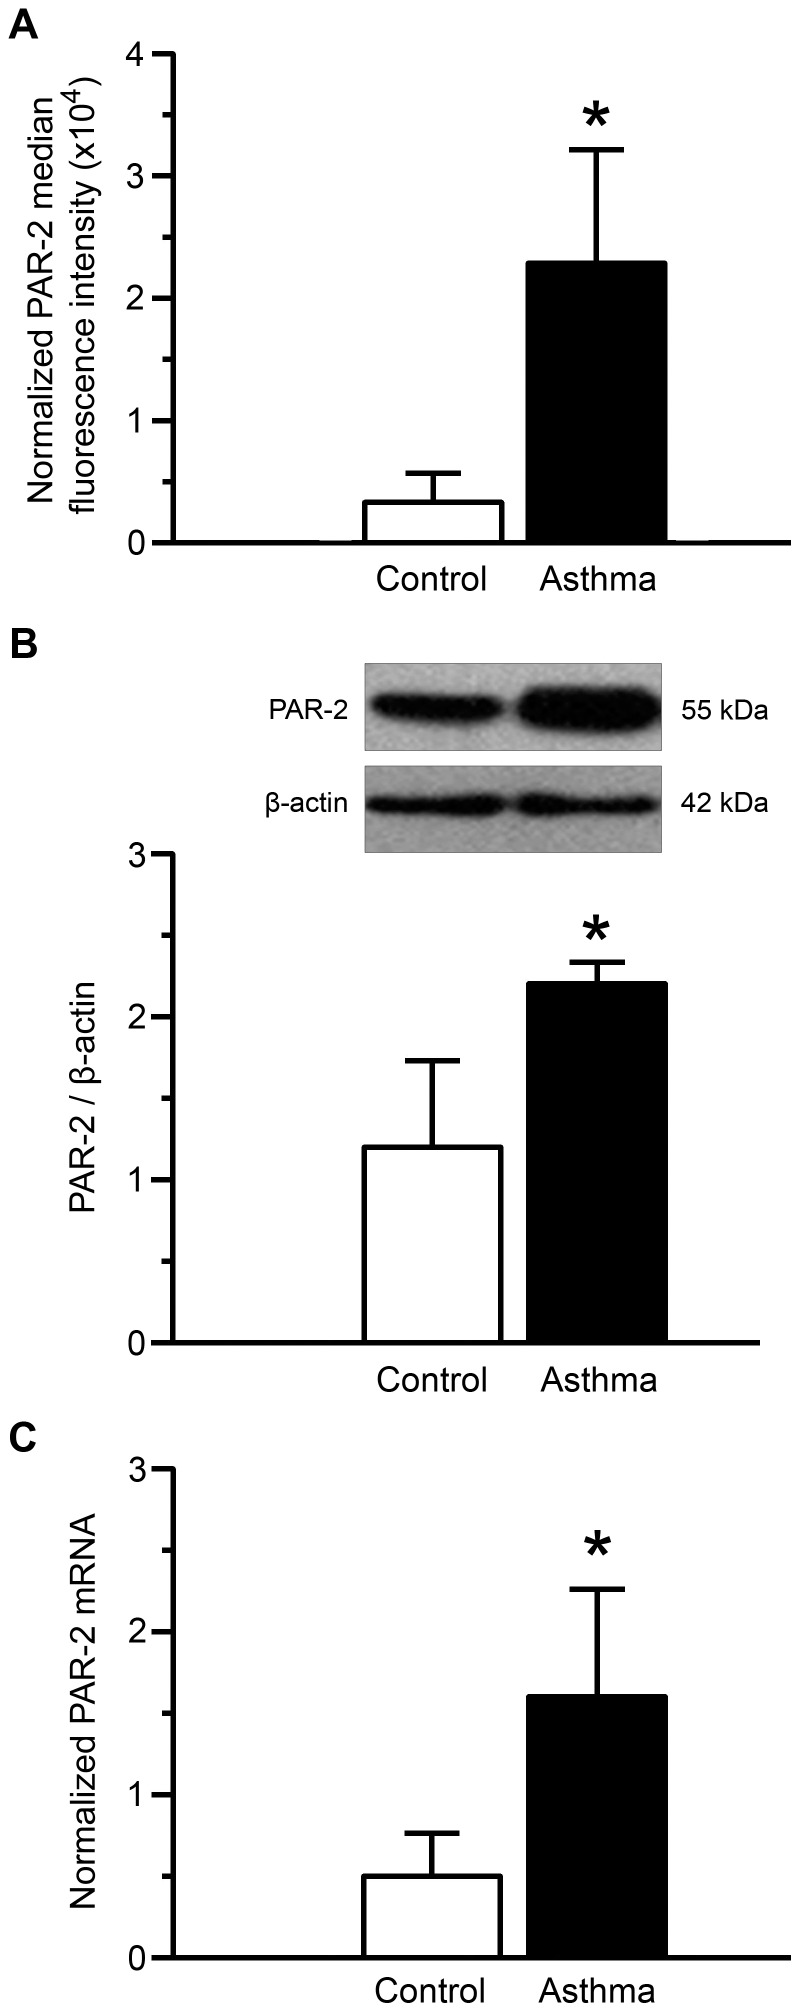
Figure 1. Increased PAR-2 expression in asthmatic bronchial smooth muscle cells.
PAR-2 levels were assessed by flow cytometry (A), western blot (B) and quantitative RT-PCR (C). Normalized median fluorescence intensities were calculated by dividing median fluorescence intensity of PAR-2 by that of isotype control (A). Representative blots stained with anti–PAR-2 or anti–β-actin antibodies are shown (B). The RT-PCR expression of PAR-2 was presented as an arbitrary unit and normalized to endogenous references (geometric averaging of three internal control genes; i.e. YWHAZ, HPRT-1, and PO) according to GeNorm (C). Bronchial smooth muscle cells were obtained from asthmatic (black bars, n = 7) and control subjects (white bars, n = 7). Results are expressed as mean ± SD. *P<0.05 using Mann & Whitney test.

