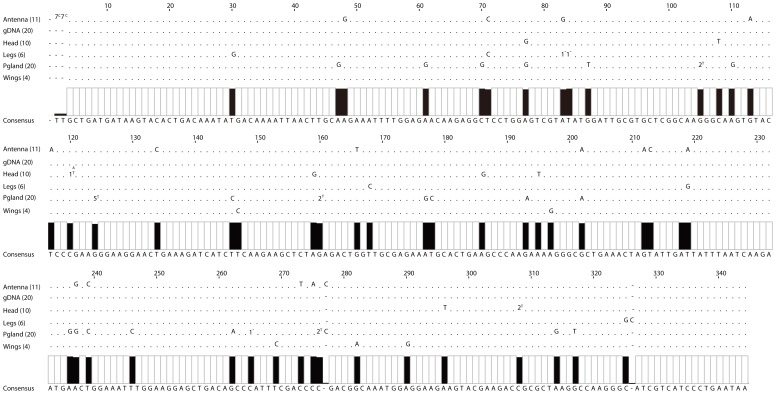
Figure 3. Tissue-specific editing on cDNA of BmorCSP mRNAs.
Sequence analysis of cDNA PCR products encoding BmorCSP1 reveals nucleotide insertion, deletion and substitution at the editing sites (black rectangles) in the antennae, head, legs, pheromone gland (Pgland) and wings. The size of the black rectangle is proportional to the frequency of RDDs at this location. The consensus sequence below the alignment corresponds to the nucleotide composition of the genomic DNA sequence (gDNA) encoding BmorCSP1. The number in brackets next to tissue indicates the number of CSP clones obtained for each tissue cDNA and gDNA. “.” indicates that the base is similar to the consensus sequence on this location. “A”, “T”, “G”, “C” point out a switch to adenosine, thymidine, guanosine and cytosine base in tissue-specific cDNA sequences, respectively. “1−” indicates base deletion in one sequence of the tissue group. “nA” indicates switch to A in n sequences of the tissue group. Number of mismatches seen in only one tissue: 38. Number of mismatches seen in two tissues: 4.

