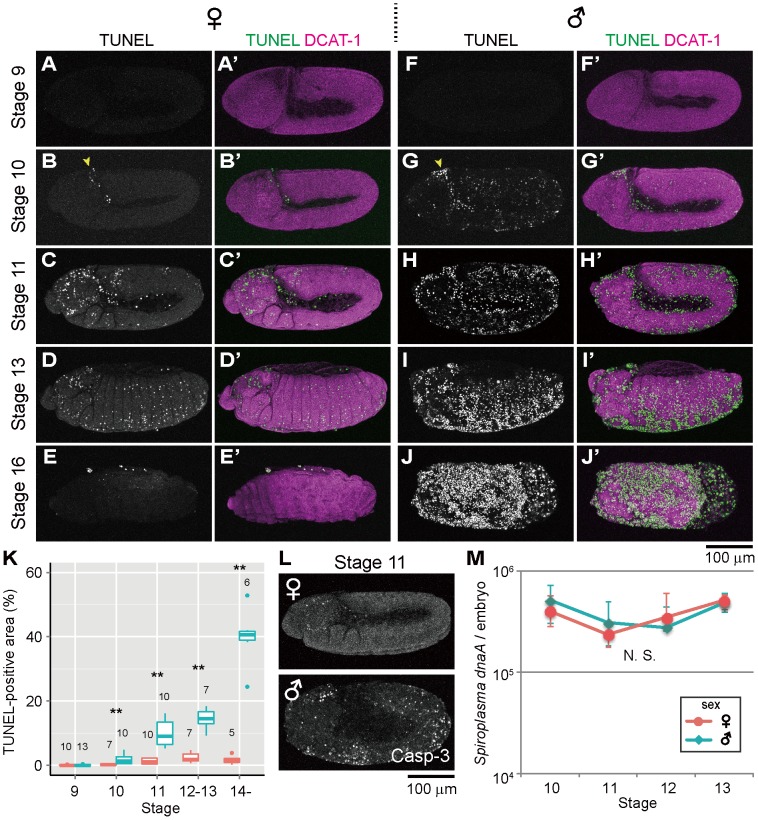
Figure 1. Ectopic cell death in Spiroplasma-infected male embryos of D. melanogaster.
(A–E) Spiroplasma-infected female embryos and (F–J) Spiroplasma-infected male embryos stained with TUNEL and an antibody against Drosophila α-Catenin (DCAT-1) for visualization of embryonic morphology. Developmental stages are indicated on the left side. Yellow arrowheads indicate the cephalic region at stage 10 where TUNEL positive cells appear first. (K) Quantification of TUNEL-positive area in Spiroplasma-infected female embryos (red) and male embryos (blue). Medians and interquartile ranges are shown with sample sizes (Wilcoxon rank sum test; **, P<0.01). (L) Anti-cleaved Caspase-3 antibody (Casp-3) staining of Spiroplasma-infected female and male embryos at stage 11. (M) Infection dynamics of the male-killing Spiroplasma in developing female embryos (red) and male embryos (blue) from stage 10 to stage 13. Infection densities are indicated in terms of symbiont dnaA gene copies per embryo. Medians and interquartile ranges of 12 measurements are shown. No significant difference was observed between sexes or stages (Kruskal-Wallis test followed by Scheffe test; P>0.05).

