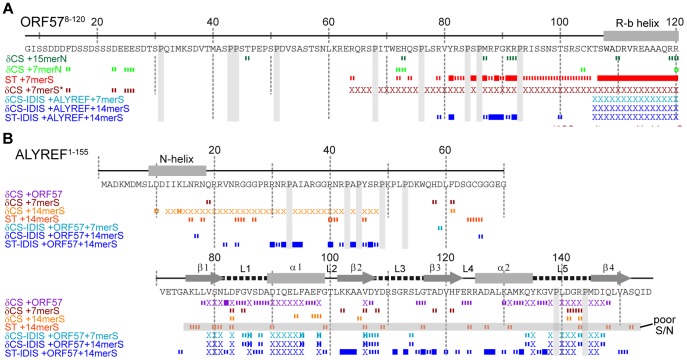
Figure 1. Overview of RNA interaction sites mapped on ORF578–120 and ALYREF1–155 using different approaches.
Backbone amide chemical shift change (δCS) and saturation transfer (ST) data are shown for ORF578–120 (A) and ALYREF1–155 (B) with different ligands added as labeled. Crosses indicate residues with signal broadened beyond detection. For δCS, large (>0.1) and moderate (>0.04) chemical shift changes of each protein relative to signals in its free state, are shown as solid and broken bars, respectively. For ST data, signal intensity ratios significantly different from the background mean values are represented by solid (>6 SD) and broken (>3 SD) bars, respectively. Labels indicate the state of the protein for each dataset, data shown for interactions with non-specific RNA (green), ORF57 specific RNA (red/orange) and ALYREF-ORF57-RNA complex (blue).

