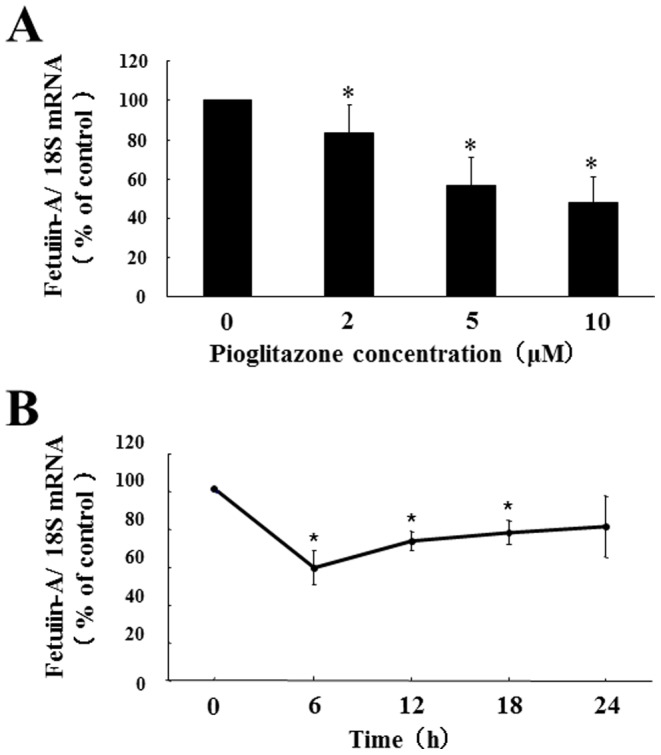
Figure 2. Effects of pioglitazone on expression of fetuin-A mRNA in Fao cells.

Fao cells were treated with pioglitazone at different doses (0, 2, 5, and 10 µM for 24 h) (A) or for different periods (0, 6, 12, 18, and 24 h with 10 µM) (B). Total RNA was isolated from Fao cells treated with or without pioglitazone, and the levels of fetuin-A mRNA expression were determined using quantitative real-time RT-PCR. Levels of fetuin-A mRNA were determined using a comparative cycle threshold method, using 18S ribosomal RNA as endogenous reference, and fetuin-A mRNA levels without pioglitazone (A) or at 0 h (B) were defined as 100% (CTL). Mean ± SD were calculated from at least three independent experiments. *P<0.05 vs. CTL.
