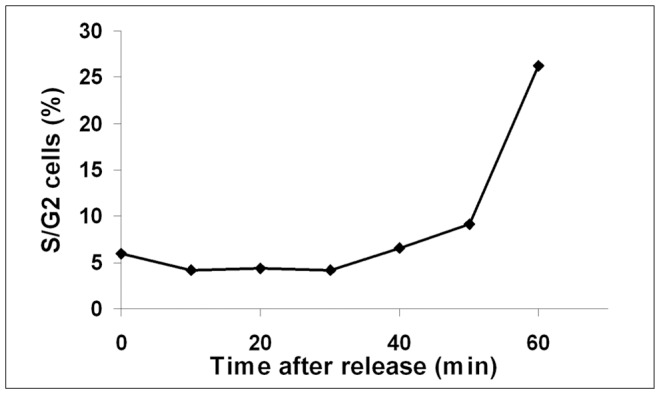
Figure 1. Timing of S phase using flow cytometry.

Cell-cycle kinetics of cells arrested in G1 phase and released into the cell cycle. Samples were harvested, fixed and processed as described, and analysed by flow cytometry (10 000 cells. The graph shows the percentage of cells in S and G2 phase at the indicated time points.
