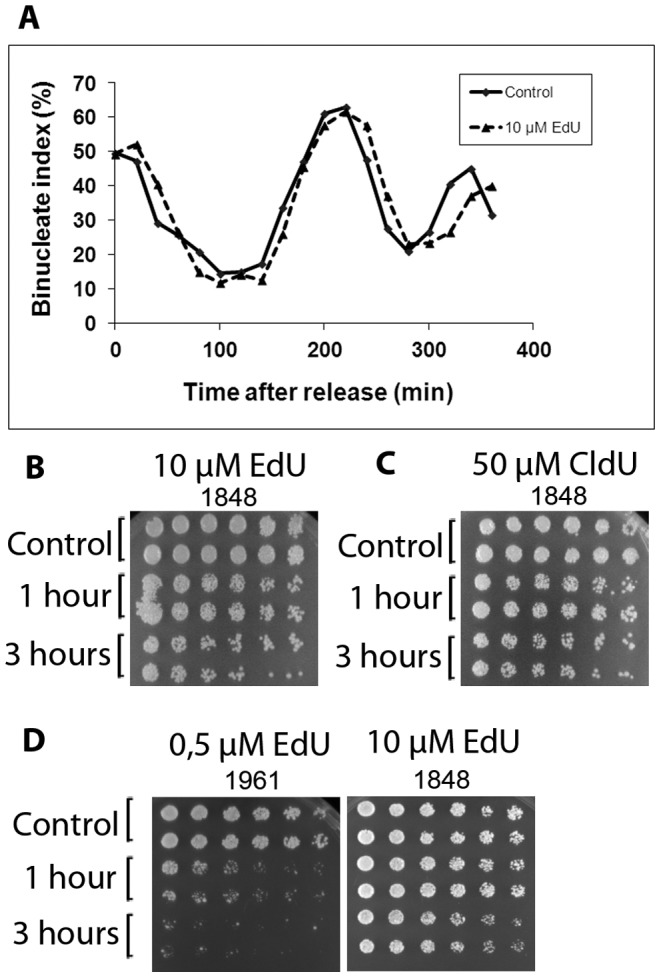
Figure 4. Cell survival after short- and long-term incubation with EdU and CldU.

A) Effect of EdU through two cell cycles. Cells synchronized in G1 phase were released and labelled for 1 hour with EdU. The cells were fixed, stained with DAPI and analyzed by flow cytometry (10 000 cells at each timepoint). The graph shows the percentage of binucleate cells (M-G1), at the indicated time points, after release into the cell cycle. B) Cells arrested in G1 phase were released in the presence of 10 µM EdU. The analogue was removed after 1 or 3 hours, as shown. The cells labelled for 1 hour were incubated for a total of 3 hours before being plated. The cells were then plated onto YES plates in a 2× serial dilution and incubated at 25°C for 3 days. Cells incubated without EdU served as controls. C) As in B, but the cells were treated with 50 µM CldU or no CldU as control. D) Comparison of the survival of the two strains 1961 and 1848 (derived from 1947 (Rhind lab) and 1402 (Forsburg lab) after treatment with EdU at the indicated concentrations.
