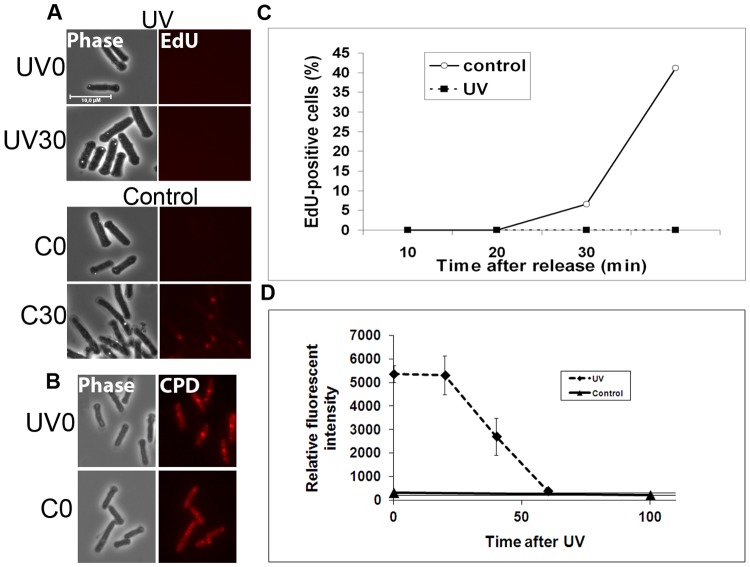
Figure 8. Detection of repair synthesis with EdU.
Cells arrested in G1 phase were released in the presence of EdU and immediately UV-irradiated with 1100 J/m2. Control cells were not irradiated. Samples were harvested at the time points indicated, fixed, processed, and imaged by fluorescence microscopy. A) Microscopy pictures of EdU -labelled UV-irradiated and control cells 0 and 30 minutes after release. B) Detection of CPD-s by indirect immunflourescence in control and UV-irradiated cells immediately after irradiation. C) The graph shows the percentage of EdU-positive cells in UV-irradiated and control cells at the different time points after release. D) The graph shows the relative fluorescence intensity of CPDs as measured by indirect immunfluorescence in UV-irradiated and control cells at the different time points after release.

