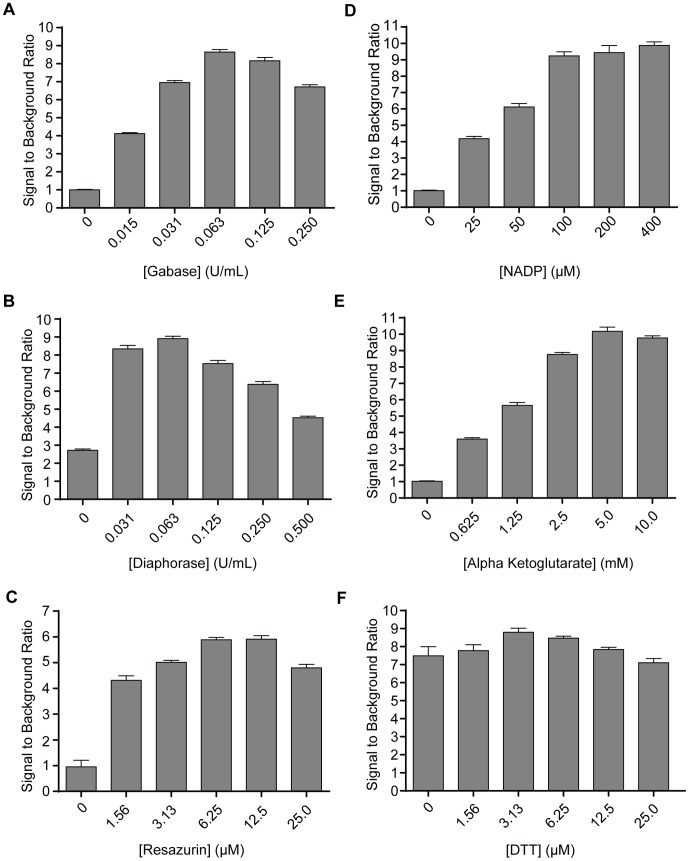
Figure 4. Optimization curves for GABase-diaphorase-resazurin coupled assay.
Each component of the reaction mix (A–F) was titrated to determine the optimal concentration to achieve the highest signal to background ratio. The final reaction mix based upon these curves was 6.25 µM resazurin, 0.063 U/mL GABase, 0.063 U/mL diaphorase, 100 µM NADP, 5 mM alpha-ketoglutarate, and 3.125 µM DTT. Data were obtained in triplicate.

