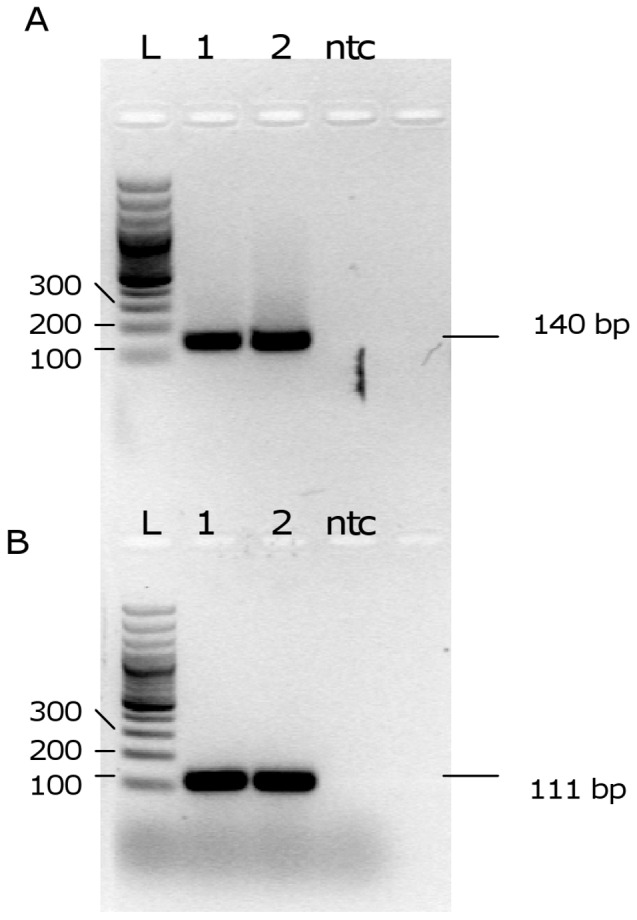
Figure 2. Electrophoretic analysis of PCR products.

Agarose gel analysis of PCR products obtained with primers MaryF-MaryR (A) and MLF-MLR (B). 1,2: PCR products obtained with L. (L.) infantum MHOM/TN/80/IPT1 DNA as template; L: ladder; ntc: no template control.
