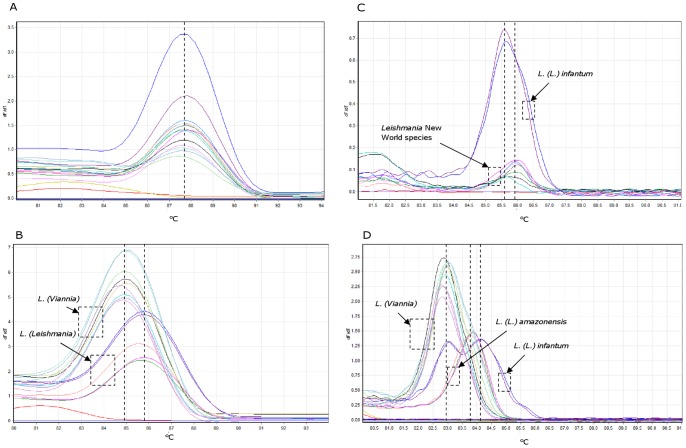
Figure 5. Melting analyses of PCR products.
Representative melting profiles of amplicons obtained with primers MaryF-MaryR (A, C) and MLF-MLR (B, D). Panels A and B show results of standard melting analysis, while panels C and D show results of HRM analysis. The species tested were L. (L.) infantum, L. (L.) amazonensis, L. (V.) guyanensis, L. (V.) panamensis, L. (V.) braziliensis. Each species was tested in duplicate or triplicate. The melting curves which did not show a melting peak represent the no template controls.

