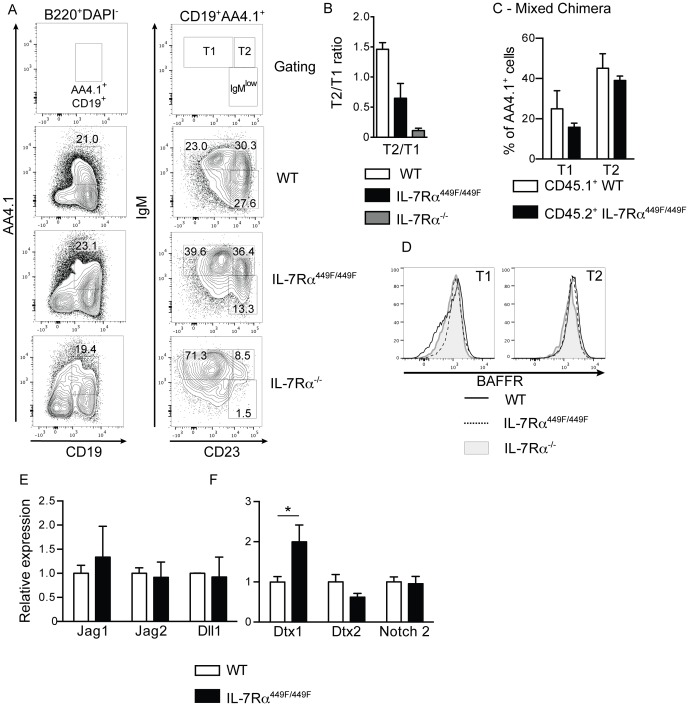
Figure 5. IL-7Rα449F/449F and IL-7Rα−/− B cells are arrested at the T1 stage within the spleen.
(A) Expression of CD19 and AA4.1 on B220+DAPI− cells in the spleen, and the proportions of T1 (IgM+CD23−) and T2 cells (IgM+CD23+) cells within the AA4.1+ population. (B) Ratio of T2 cells to T1 in the spleens of WT (n = 4), IL-7Rα449F/449F (n = 3) and IL-7Rα−/− mice (n = 5). (C) Proportions of T1 and T2 populations in 9∶1 BoyJ: IL-7Rα449F/449F mixed bone marrow chimeras (n = 4) from figure 2B. (D) Surface expression of BAFFR on T1 and T2 cells from WT, IL-7Rα449F/449F and IL-7Rα−/− mice. (E) RNA levels of notch ligands Jag1, Jag2 and Dll2 in the spleen of WT, IL-7Rα449F/449F and IL-7Rα−/− mice. (F) Expression of Deltex1, Deltex2 and Notch2 on sorted spleen T1 cells. Shown is mean of three cDNA preparations for each genotype.

