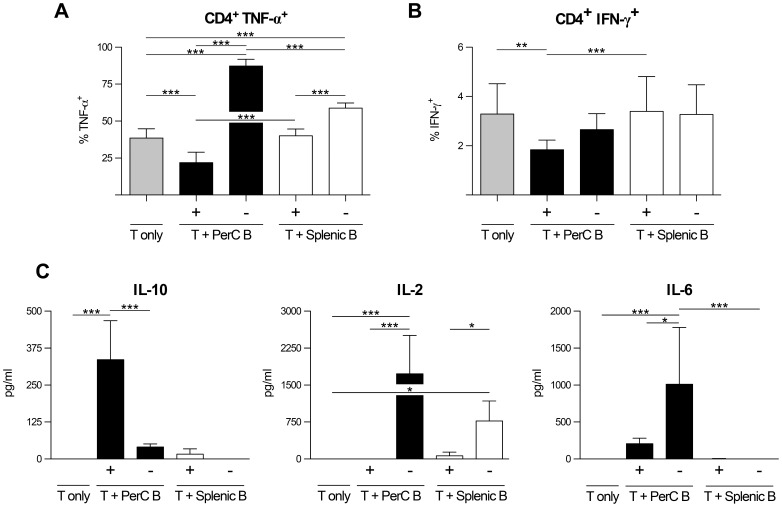
Figure 5. Activation status of B cells is critical for the effects exerted on T cells.
B- and T cell cultures and subsequent intracellular staining were performed as explained in the legend of Figure 4. The percentages of T cells producing TNF-α (A) and IFN-γ (B) after co-culture with indicated activated (+) or non-activated (–) B cell subsets is shown. In A and B the mean ± S.D. are depicted of pooled results from two identical replicate experiments (with at least triplicate technical replicates each) that produced similar data. The cytokine levels of indicated B- and T cell cultures (C) were determined from the supernatant using Luminex. Levels shown in C are the mean ± S.D. of pooled results from two identical replicate experiments (with at least triplicate technical replicates each). Statistically significant differences between the various culture conditions were calculated using a one-way ANOVA with Bonferroni post-hoc test. *p<0.05, ** p<0.01, *** p<0.001.

