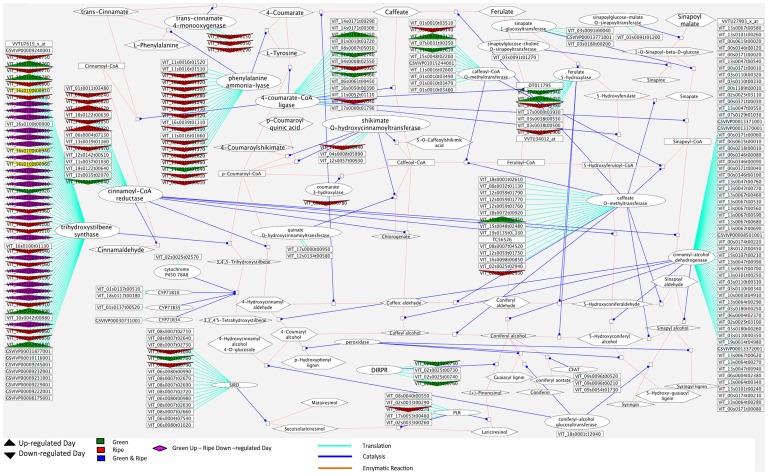
Figure 7. Cytoscape image of day/night modulated transcripts within the phenylpropanoid pathway.
Only transcripts that were modulated at either, both green or both ripe stages (fold change >2; pval adj <0.05) are displayed. Arrow pointing upwards: up-regulated during the day (down-regulated at night); Arrow pointing downwards: down-regulated during the day (up-regulated at night). Green Arrow: Same regulation at G1 and G2; Red Arrow: Same regulation at R1 and R2; Purple Parallelogram: Day up-regulated in green stages; Day down-regulated in ripe stages; Magenta lines: Translation; Blue lines: Catalysis; Brown line: enzymatic reaction.

