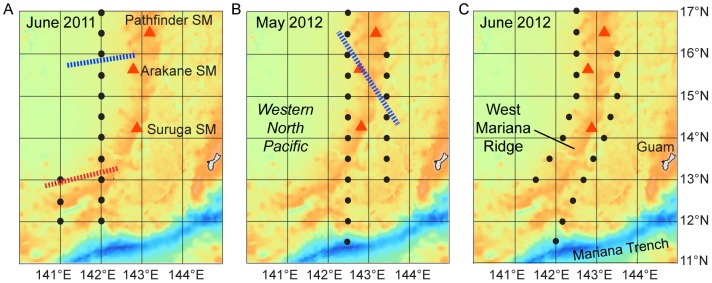
Figure 2. Hydrographic stations along the West Mariana Ridge.

The locations of CTD or X-CTD profile stations during the three surveys in 2011 and 2012 are shown with black dots. The estimated location and angle of the salinity front crossing the ridge (red line) and the northern extent of the layer of low salinity water usually associated with the salinity fronts (≤34.5) (blue lines) if present are also shown. Three shallow seamounts (SM) previously investigated are shown (red triangles).
