
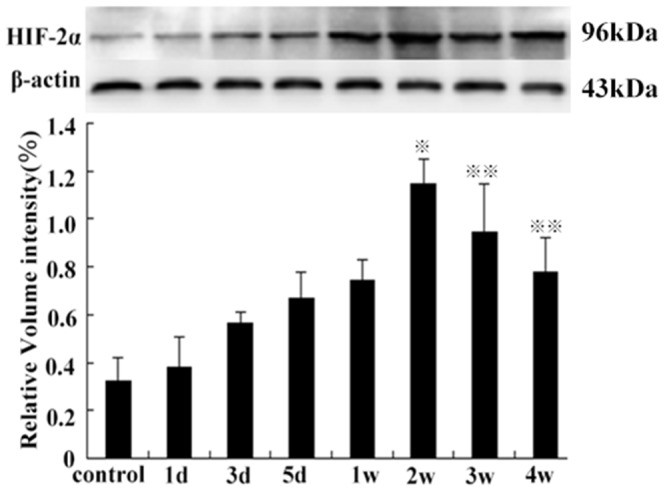
Figure 9. The HIF-2α protein levels on the 2nd week, compared with the control group ( P<0.01), from the 2nd to 4th week (
 P<0.05, compared with the control group).
Official websites use .gov
A
.gov website belongs to an official
government organization in the United States.
Secure .gov websites use HTTPS
A lock (
) or https:// means you've safely
connected to the .gov website. Share sensitive
information only on official, secure websites.
P<0.01), from the 2nd to 4th week (
P<0.05, compared with the control group).