
Figure 4.
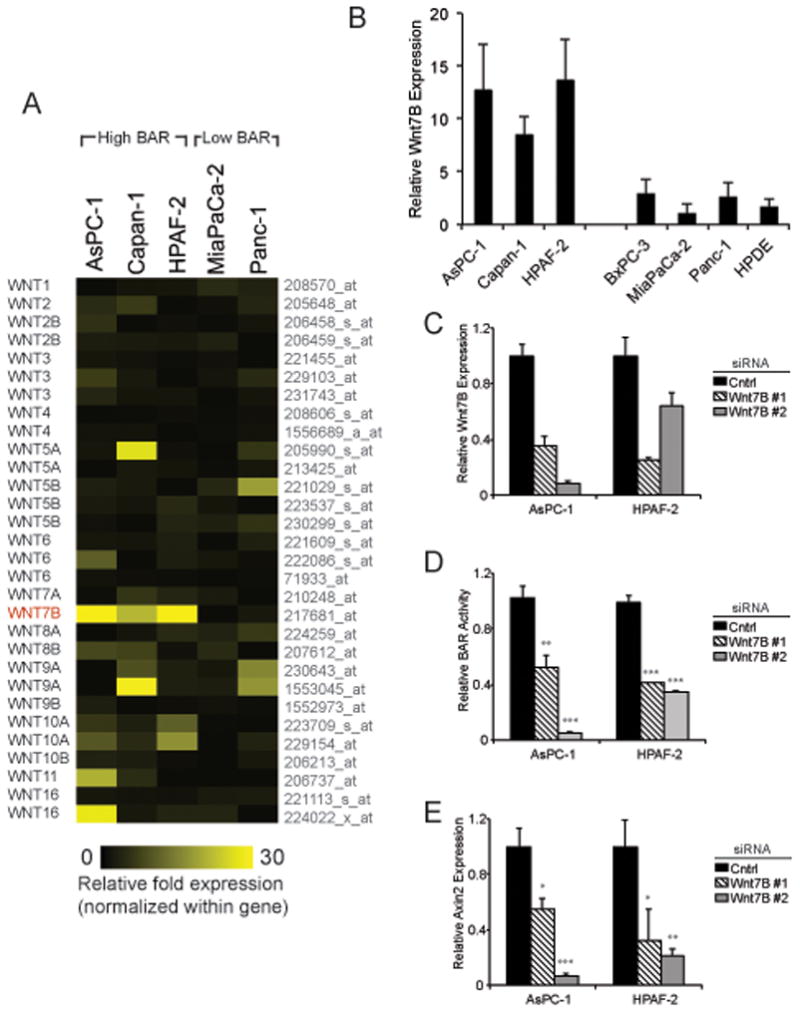
(a) Heatmap showing relative fold-change in gene expression for each Wnt ligand across PDAC cell lines as determined by Affymetrix U133 plus 2.0 oligonucleotide arrays. (b) Relative WNT7B expression for indicated cell lines by QPCR. (c–e) Cell lines with stable BAR-luciferase reporter were transiently transfected with control or WNT7B siRNAs. At 48 hours post-transfection, cells were analyzed by QPCR for (c) WNT7B or (e) AXIN2 expression, as well as (d) BAR-luciferase activity. ACTB served as normalization control for QPCR.