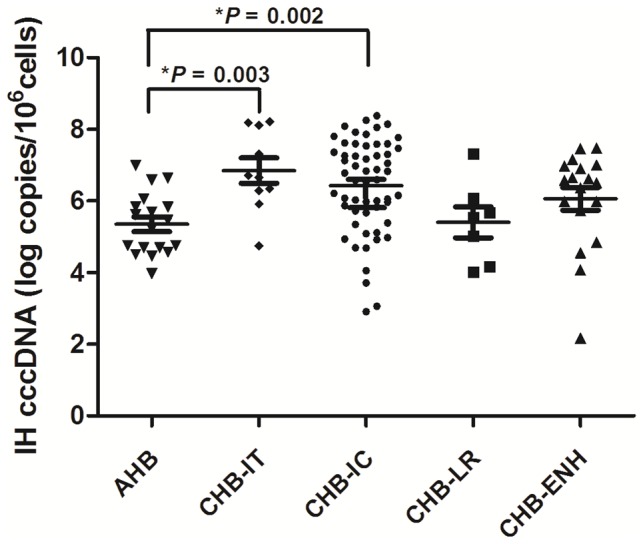
Figure 1. Comparison of intrahepatic (IH) HBV cccDNA levels among patients with different clinical presentations.

The horizontal lines illustrate the 25th, 50th, and 75th percentiles of the cccDNA levels. Symbols * and ** represent P value less than 0.01 and 0.05, respectively. AHB, acute hepatitis B; CHB, chronic HBV infection; IT, immune-tolerant; IC, immune-clearance; LR, low-replicative; ENH, HBeAg-negative hepatitis.
