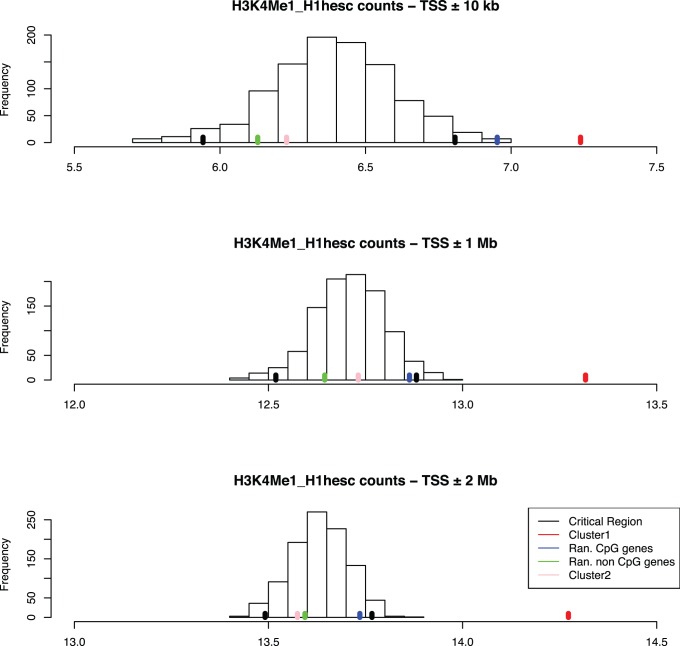
Figure 4. Statistical significance test for H3K4me1 around different genomic distributions.
A) H3K4me1 distribution in different clusters across ±10 kb TSS against the random background distribution. B) H3K4me1 distribution in different clusters across ±1 Mb TSS with respect to random background distribution. C) H3k4me1 distribution in different clusters across ±2 Mb TSS with respect to random background distribution. This figure shows that cluster 1 (shown by red bar) has significantly higher distribution of H3K4me1 in comparison to random selected background region (marked by black bars), CpG and non-CpG region (shown by blue and green bar respectively) and cluster 2 genes (shown by pink bar).

