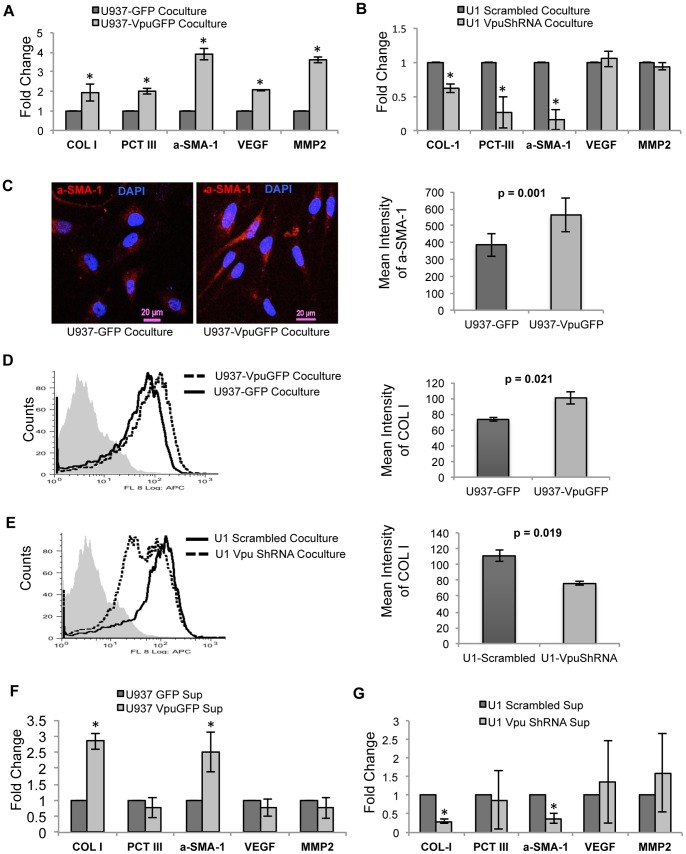
Figure 2. Profibrogenic effects of HIV-1 Vpu expressing monocytes on human hepatic stellate LX2 cells.
The LX2 cells were cocultured with (A) U937-VpuGFP and U937-GFP cells or (B) U1-Scrambled and U1-VpuShRNA cells, as described in Methods. The expression levels of the indicated mRNAs in the LX2 cells were then estimated by qRT-PCR. All expression values were normalized to those in the control cells, n = 3. (C) Confocal microscopic analysis of intracellular αSMA-1 expression in LX2 cells cocultured with either U937-GFP or U937-VpuGFP cells. The bar plot on the right represents the mean intensity of αSMA-1 in the LX2 cells, n = 32. Flow cytometric analysis of intracellular COL-1 levels in LX2 cells cocultured with (D) U937-VpuGFP and U937-GFP cells or (E) U1-Scrambled and U1-VpuShRNA cells. The bar plot on the right represents the mean fluorescence intensity (MFI) of COL-1 in the LX2 cells, n = 3. The LX2 cells were treated with culture supernatants from (F) U937-VpuGFP and U937-GFP cells or (G) U1-Scrambled and U1-VpuShRNA cells, as described in Methods. The expression levels of the indicated mRNAs in the LX2 cells were then estimated by qRT-PCR. All expression values were normalized to those in the control cells, n = 3. Error bars represent mean ± SD (*, p<0.05).

