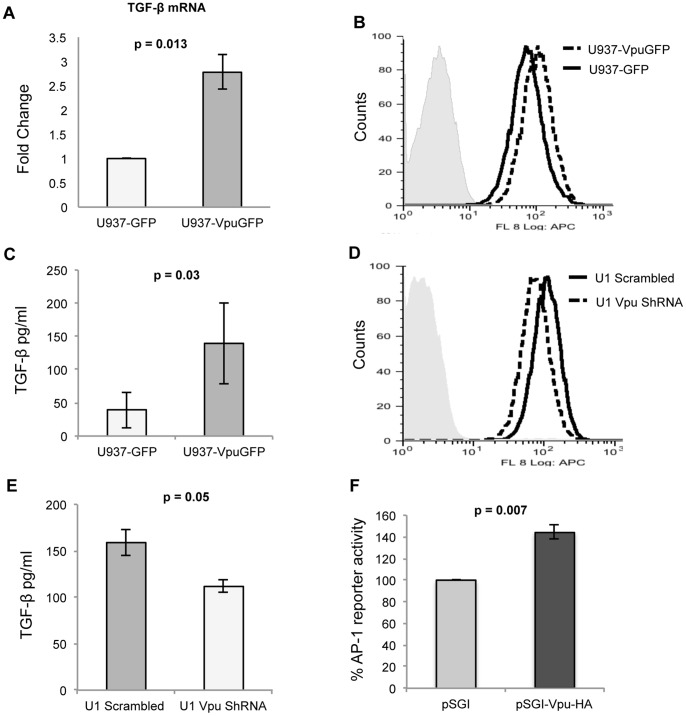
Figure 3. Vpu expressing monocytes show increased levels of TGF-β.
(A) Quantitative RT-PCR of TGF-β mRNA levels in U937-GFP and U937-VpuGFP cells, expressed as fold-change in the latter compared to the former. (B) Flow cytometric analysis of TGF-β expression in U937-VpuGFP and U937-GFP stable cell lines. (C) Quantitation of TGF-β secreted in the culture media of U937-VpuGFP and U937-GFP stable cell lines. (D) Flow cytometric analysis of TGF-β expression in U1-scrambled and U1-VpuShRNA stable cell lines. (E) Quantitation of TGF-β secreted in the culture media of U1-scrambled and U1-VpuShRNA stable cell lines. (F) Luciferase reporter quantitation of AP-1 activity in HEK293T cells transfected with expression vector pSGI-Vpu-HA compared to the empty pSGI-HA vector. Error bars represent mean ± SD from three independent experiments.

