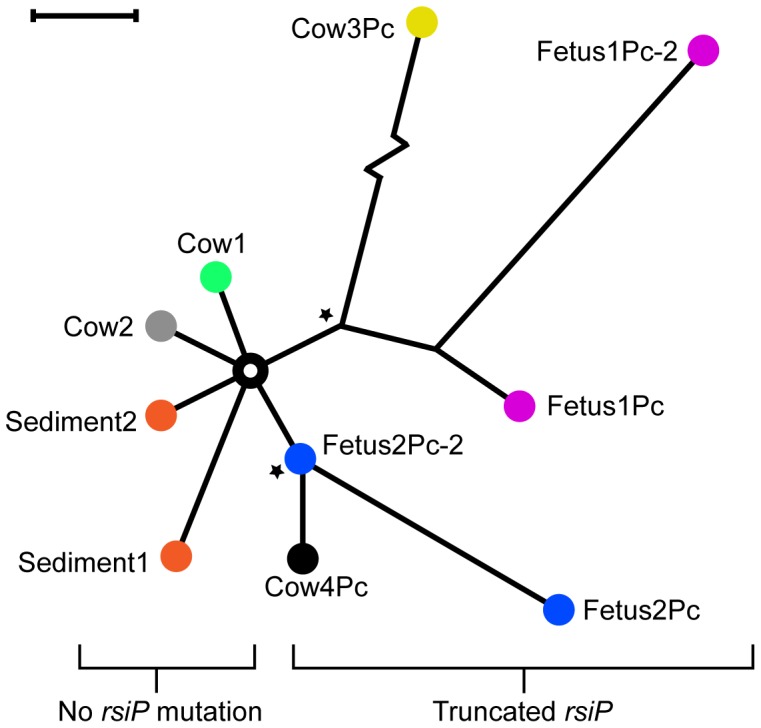
Figure 1. The relationship between the mutational profiles of different isolates in this study.

The dendrogram was made by identifying and concatenating all SNPs and indels in the chromosomes. The different colors represent different animals. For some animals, two independent isolates were recovered. The “Sediment” isolates were recovered from the presumed source of infection. Stars represent two different mutations in the gene rsiP that led to penicillin resistance. The Cow3Pc isolate showed 54 chromosomal mutations compared to Cow1 (indicated as a zigzag line). The black bar equals 1 bp difference.
