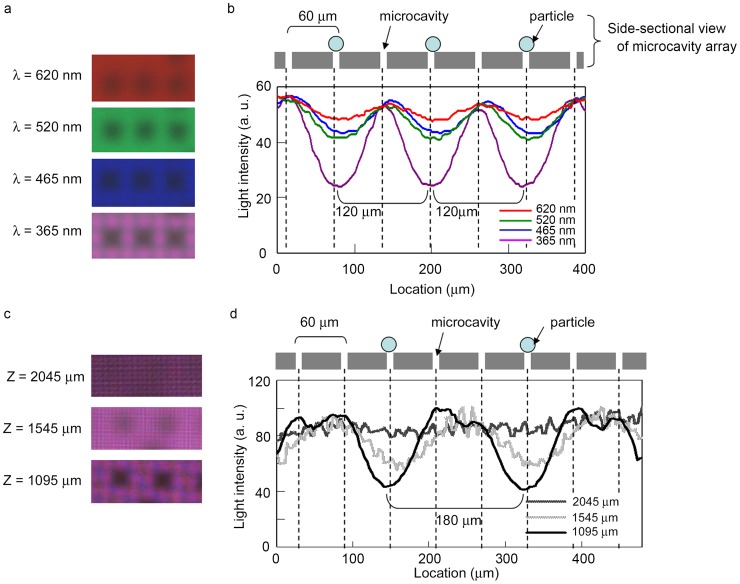
Figure 4. Effects of wavelength and distance between the microcavity array and sensor surface on shadow patterns.
(a, c) Parts of the CMOS sensor images corresponding to selected rows of microcavities acquired under illumination at various wavelengths in constant distance: 1,095 µm (a) and at various distances in constant wavelength: 365 nm (c). Three of the seven microcavities in a row (a) and two of the eight microcavities in a row (c) were occupied by microparticles. (b, d) Cross-sectional variation in light intensity was measured in each image.

