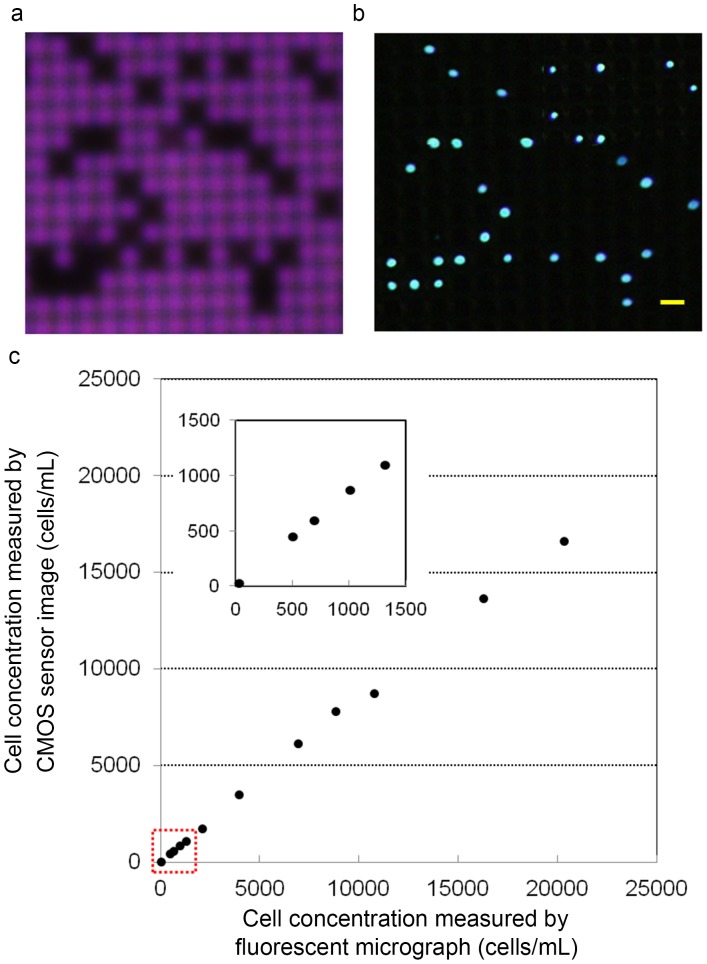
Figure 6. Evaluation of cell counting accuracy.
CMOS sensor image (a) and fluorescent micrograph (b) of HeLa cells trapped on a microcavity array. Scale bar; 60 µm. (c) Cell count measured by CMOS sensor images compared with the count of HeLa cells stained with Hoechst 33342 in the fluorescent micrograph. Plot area in lower range (red box) is enlarged and shown on the top left side.

