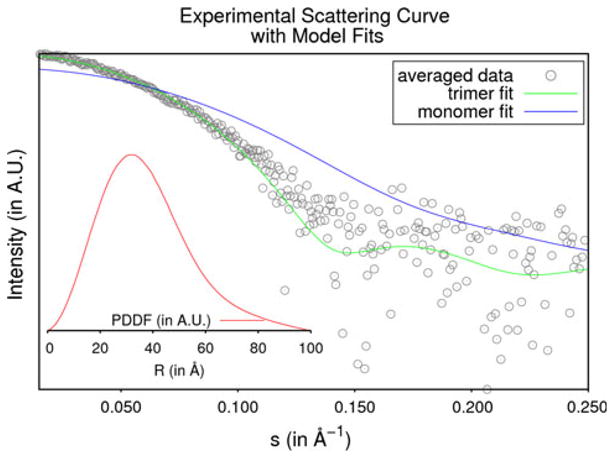
Fig. 3.

Small-angle X-ray scattering data of SACOL2570. The averaged experimental data for SACOL2570 are shown as grey circles. The theoretical scattering curves for the monomeric and trimeric models are shown in blue and green respectively. The inlaid figure shows the particle distance distribution function in red
