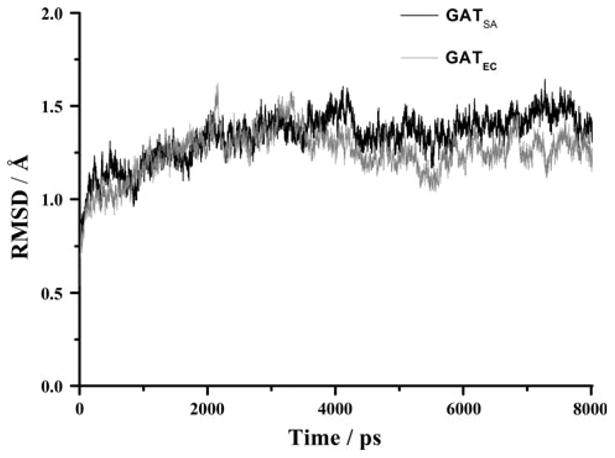
Fig. 5.

Plots of RMSD versus simulation time in the MD-simulated SACOL2570 GATSA(black) from S. aureus (PDB code: 3FTT) and galactoside acetyltransferase GATEC (grey) from E. coli (PDB code: 1KRR). RMSD represents the root mean-square deviation (Å) of the simulated positions of the backbone atoms (C, N, and Cα) of SACOL2570 and GATEC from those in the initial X-ray crystal structure
