
Figure 3.
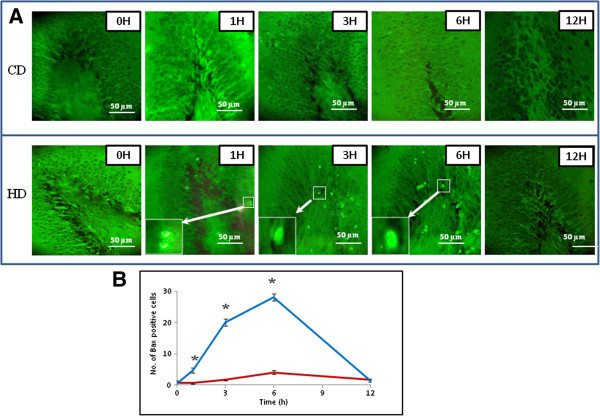
Representative photographs showing HD-induced Bax protein expression in neuronal cells of the DG region. (A) HD increased number of Bax positive cells in a time-dependent manner (Figs. HD, 1–6 H) during initial period (1–6 h) as compared to their respective CD groups (Figs. CD, 1–6 H). Enlarge view of Bax positive neuronal cells of the same figure (inset). Scale bar = 50 μM. (B) Quantitative analysis of Bax positive neuronal cells in DG region. Data are mean ± SEM of three independent experiments and analyzed by One-Way ANOVA followed by Tukey test. “*” Denote significantly different at p < 0.05 level. Blue line denote HD, red line denote CD.