
Figure 4.
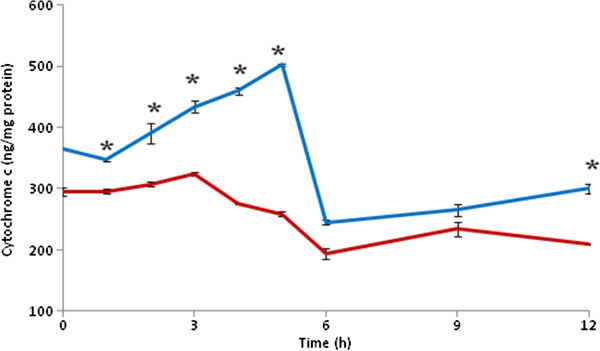
HD increased cytochrome c concentration in brain. Data are mean ± SEM of three independent experiments and analyzed by Two-Way ANOVA followed by Tukey test. “*” Denote significantly different at p < 0.05 level. Blue line denote HD, red line denote CD.