
Table 4.
Comparison of blood mercury concentration by the demographic characteristics with ANOVA (Unit: µg/L)
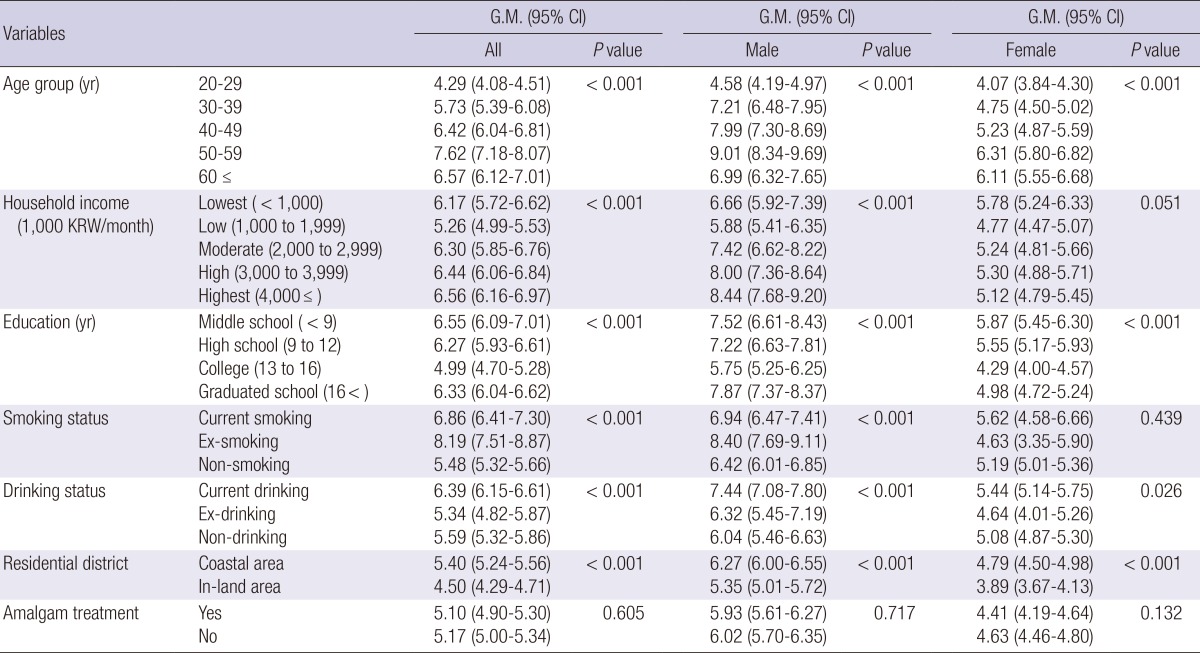
G.M., geometric means; CI, confidence interval.
Official websites use .gov
A
.gov website belongs to an official
government organization in the United States.
Secure .gov websites use HTTPS
A lock (
) or https:// means you've safely
connected to the .gov website. Share sensitive
information only on official, secure websites.
Comparison of blood mercury concentration by the demographic characteristics with ANOVA (Unit: µg/L)
G.M., geometric means; CI, confidence interval.