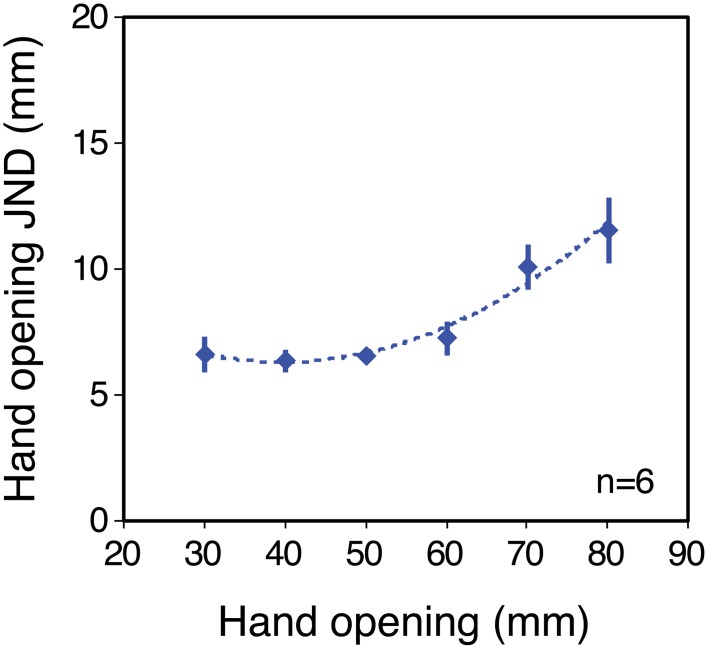
Figure 3.
Sensitivity to hand opening in the no-tool condition. The figure plots JNDs in hand opening as a function of hand opening, averaged across the six observers (for individual results, see Supplementary material). The dashed line shows a second-order polynomial fit to the data, used to generate predictions for the tool conditions. Error bars denote ± 1 standard error.

