

Abstract
In this study, we characterize changes in the genome during a swift evolutionary adaptation, by combining experimental selection with high-throughput sequencing. We imposed strong experimental selection on an ecologically relevant trait, parasitoid resistance in Drosophila melanogaster against Asobara tabida. Replicated selection lines rapidly evolved towards enhanced immunity. Larval survival after parasitization increased twofold after just five generations of selection. Whole-genome sequencing revealed that the fast and strong selection response in innate immunity produced multiple, highly localized genomic changes. We identified narrow genomic regions carrying a significant signature of selection, which were present across all chromosomes and covered in total less than 5% of the whole D. melanogaster genome. We identified segregating sites with highly significant changes in frequency between control and selection lines that fell within these narrow ‘selected regions’. These segregating sites were associated with 42 genes that constitute possible targets of selection. A region on chromosome 2R was highly enriched in significant segregating sites and may be of major effect on parasitoid defence. The high genetic variability and small linkage blocks in our base population are likely responsible for allowing this complex trait to evolve without causing widespread erosive effects in the genome, even under such a fast and strong selective regime.
Keywords: experimental selection, Drosophila melanogaster, immunity, parasitoid defence, quantitative genetics, high-throughput-sequencing
1. Introduction
Pathogens and parasites form an important and strong selection pressure in nature, and consequently immune responses are among the fastest evolving traits. The immune system can defend against an array of parasites. The response to this parasitic pressure is multi-faceted and requires successful completion of various physiological processes. Generally, a successful immune response (i) recognizes the threat, (ii) triggers and regulates specific immune pathways and (iii) neutralizes the threat. Neutralization can involve the humoral release of defensive components that directly attack the pathogen, as well as immune-competent cells for the phagocytosis, lysis or sequestering of the pathogens. Immune responses can be costly, both during the induced response and during the more constitutive level of readiness to quickly trigger an adequate response [1]. Evolution of immune responses reflects physiological and evolutionary costs and benefits, for instance energetic costs, autoimmunity and pleiotropic effects. These processes are in turn mediated by the environment, for example through trade-offs in resistance to different pathogens through allele matching, in trade-offs between immunity versus other life-history traits (such as reproduction or competition) or by local parasite pressures (both in type and frequency) [2–4].
Substantial genetic variation in immunity exists in Drosophila melanogaster for the resistance to parasitoids. Parasitoids are insects whose larvae feed on a host in order to complete development, and in this process kill the host. Parasitoids can cause high mortality in the ecology of D. melanogaster and parasitoid resistance is well studied, both in terms of mechanisms, population differences and interactions with various parasitoid species [5]. Drosophila species differ substantially in their ability to successfully induce an immune response against parasitoid eggs [6,7]. Drosophila melanogaster also shows a high level of within-species variation in parasitoid immune defence, including strong geographical variation [8,9]. Moreover, Drosophila defences show a fast and powerful response to experimental selection to parasitoids, and associated changes in phenotypic traits and gene expression have been characterized [10–14]. Expression studies investigating differences between parasitized and non-parasitized D. melanogaster larvae [7,11] or larvae from populations artificially selected for increased parasitoid resistance indicate limited overlap between differentially expressed genes [10]. This suggests that the variation in immunity against parasitoids could not be explained by a simple regulation of pre-activation of the inducible response and likely has a more complex genetic basis.
Drosophila, like all invertebrates, only has an innate (and not adaptive) immune system to defend against immune compromise. During the immune response against parasitoids in D. melanogaster, three types of haemocytes (i.e. blood cells in invertebrates) are mobilized and strongly induced through haemocyte proliferation and differentiation: plasmatocytes, lamellocytes and crystal cells [15]. These haemocytes mediate melanotic encapsulation, a process where the plasmatocytes (the predominant type of haemocytes, involved in phagocytosis and encapsulation) and lamellocytes (large, flat and adherent cells) surround the parasitoid egg, become attached to the egg and to each other to form a multi-layered cellular capsule. The parasitoid egg and capsule are melanized through reactive components of the prophenol oxidase cascade, for which the precursors are supplied by the crystal cells and lamellocytes, killing the parasitoid egg [16,17]. Lamellocytes are not found in embryos or adults flies, and rarely in healthy larvae. Upon infection with a parasitoid egg, large numbers of these cells can be recruited into the haemolymph [16,17]. Of the immunity-related pathways, JAK-STAT, Ras/Raf/MAPK and Toll signalling pathways have been implicated in haemocyte differentiation and proliferation and may be of particular importance in parasitoid immune responses [15–17].
To describe the genomic changes during the fast evolution of increased resistance, we can combine artificial or experimental selection approaches with high-throughput-sequencing technology [18,19]. Studies on bacterial evolution, drug resistance and domestication [20–22] were the first to combine these approaches, while more evolutionary and ecological questions are now also being addressed [23–30]. Experimental selection is a powerful method to mimic replicate selection events, as they could occur in nature. In artificial selection experiments, replicate populations can evolve under controlled conditions. Using replicate populations derived from a single base population helps to separate the confounding effects of genetic drift from the effects of selective processes. Subsequent genome sequencing of replicated selected and control lines can then reveal genome regions that have been affected by the selection process.
Studies on the impact of artificial selection on the genome often focus on long-term selection (generally more than 50 generations) and often apply a relatively low (non-lethal) selection pressure [28–30]. This could emulate gradual processes, such as slow environmental change or a species range expansion. By contrast, in this study we are specifically interested in the genomic changes owing to a sudden and strong selection pressure on a complex trait. In nature, selection differentials are often high, as populations may frequently encounter novel and/or strong selection pressures that threaten their survival or reproduction. When selection acts upon complex polygenic traits, processes such as epistasis and pleiotropy may be important constraining factors. Strong and sudden selection pressures can be caused by both abiotic factors (such as temperature fluctuations, heavy metal concentrations or flooding) and biotic factors, including changes in ecological community and parasite–host dynamics. Such events can wipe out a significant proportion of the natural population, while causing a selective sweep of those alleles that enhance the survival of individuals during such events. To map the genomic changes in a population during such rapid selective sweeps, we will focus on the effects of strong selection causing a pronounced phenotypic change in a complex trait, immunity, over a limited number of generations. We expect fast-acting selection to act upon standing variation and on allele combinations already present in the populations, while mutation and achieving new favourable allele combinations through recombination will play a less important role.
In this study, we use whole-genome sequencing of D. melanogaster selection and control lines differing in parasitoid resistance, to assess how selection on this trait impacts the genome. We used a naturally derived base population, kept at large population sizes, and selected for increased immunological resistance against the parasitoid Asobara tabida over five generations, similar to the study of [14]. The selection procedure was replicated for four lines and these selection lines were compared to matched control lines. As the large population size was only reduced during selection, and drift is accounted for through replication, our design minimizes sampling linkage disequilibrium (LD) and is expected to minimize the number of chance associations. We sequenced a pool of 50 individuals for each of these eight lines (four selection and four control). We identified multi-allelic sites across the genome and compared various population genetic measures across small windows of the genome. We use these data to assess the effect of the rapid selective sweep across the genome, to identify regions with a signature of selection and to infer possible candidate genes associated with parasitoid resistance. We discuss our results in relation to how rapid evolution is likely to proceed in natural situations.
2. Material and methods
(a). Selection lines for increased parasitoid resistance
The founding population for our selection and control lines was generated from a wild population of D. melanogaster that was established from 250 wild-caught flies, collected near Leiden, The Netherlands in 1995 [10,14]. It was kept as four separate large outbred control populations, typically with population sizes well over 1000 flies per generation. We mixed the four populations for five generations before we started our selection in 2009 to avoid population substructuring.
Adult females of approximately 7–10 days old were used for egg laying. Oviposition was at 25°C, after which larvae were reared at 20°C (the optimal temperature for the development of the parasitoid wasps). To avoid crowding, larval density was standardized at the early second-instar stage by transferring approximately 200 larvae to a new bottle. As a selective agent, we used A. tabida parasitoid wasps from the ‘SOS’-strain (collected in Sospel, France, and kept in the laboratory for more than 10 years). The parasitoids were cultured on Drosophila subobscura hosts that show no parasitoid resistance and were maintained under standard culturing conditions (20°C, 12 L : 12 D). Wasps were collected after eclosion and stored at 12°C in bottles with agar-medium (without yeast or sugar) to maintain humidity and provided with honey. Eclosed wasps were allowed to mature during 7–21 days before use in the selection experiment.
At the start of the selection regime, D. melanogaster larvae from a single cohort of the base population were allocated to four separate pairs of selection and control lines. Approximately 200 second-instar larvae were transferred to new medium bottles containing a thin layer of yeast. In the selection lines, the second-instar larvae were subsequently exposed to the parasitoid during 24 h by adding three to five parasitoid female wasps and one to two male wasps per bottle. Each generation consisted of minimally 10 bottles per line (for initial generations up to 40 bottles per line). After the removal of the parasitoid wasps, the larvae were left to develop normally. After pupation, each pupa was manually checked under a stereo-microscope for melanized parasitoid eggs, which are visible through the puparial wall. Only those pupae that contained a visible capsule and survived to adulthood were taken to the next generation. This approach ensured that only flies that (i) were parasitized and (ii) had successfully defended themselves against the parasitoid attack could contribute to the next generation. Average population size in the selection lines was 242 per line, with a minimum of 88 flies. We selected for five generations. For each selection line, we set up a matched control line that was cultured in parallel with the selected line. For these control lines, we transferred the same number of pupae to each next generation. As mortality rates in the control lines were much smaller (because they were not exposed to parasitoids), the population sizes for these control lines were considerably higher.
After five generations of selection, resistance levels of each of the lines were measured. We measured resistance by exposing replicated Petri dishes (containing fly medium and a thin layer of yeast at the centre) with 20 second-instar larvae for 2 h to a parasitoid wasp of the same SOS strain as those used during the selection experiment. We dissected the larvae just before pupation 96 h after parasitization (third-instar stage) and scored the percentage of the surface of each parasitoid egg that was covered by melanin. Only singly parasitized larvae were included in the analyses (average N per line = 75 ± 14). Resistance was scored as the proportion of parasitoid eggs that were fully melanized and compared between selection and control lines. Data were analysed using Generalized Linear Models, implemented in R 3.0.1, specifying a quasi-binomial distribution to correct for overdispersion and using F-tests to test for significance of the differences in resistance between the selection and control lines. Encapsulation state (success or failure) was the response variable and control or selection treatment and replicate (nested within treatment) explanatory variables. The data were analysed per Petri dish to avoid pseudo-replication.
(b). Sequencing analysis
Samples for sequencing were taken after one generation of relaxation of the selection regime. All fly samples were collected as virgins within 5 h of eclosion and stored at −80°C. Pooled samples of 50 female flies per line were manually homogenized with a pestle and DNA was extracted using the Qiagen DNeasy Blood & Tissue Kit according to the manufacturer's instructions. Illumina library construction was performed using the protocols of [31]. DNA was quantified using a Qubit fluorometer (Invitrogen). Additional DNA and gel purification steps were conducted using Clean & Concentrator kits (Zymo Research).
Genomic DNA from each of the eight populations was sequenced as single end 101 bp reads across eight lanes of an Illumina GAII. Reads were aligned to the complete D. melanogaster 5.29 genome using BWA 0.5.7 [32], allowing up to eight mismatches throughout the read. Only unique reads were mapped to the genome. All other BWA alignment parameters were kept at default settings. Reads were filtered through the GATK workflow [33] using default settings, consisting of duplicate removal, indel realignment and base quality score recalibration [34]. Single nucleotide polymorphisms (SNPs) were called directly from the resulting pile-up file using bases with phred quality of more than 20.
Initially, reads from all eight populations were pooled to identify multi-allelic sites across the genome. For this, at least two alleles had to be observed in the pooled data, with an allele being called at least five times with a frequency of at least 5% in the pooled data. To assess significance of differences in allele frequencies for these multi-allelic sites, a Fisher's exact test was used to compare the counts of all base calls at each position between Selection (S) and Control (C) populations (either as independent replicate pairs or pooled control and pooled selection lines). We applied a false discovery rate (FDR) correction and used a cut-off of 0.01 to designate allele differences significant.
To identify genomic signatures of selection in the genome, we compared allele frequencies and tested for significant differentiation between treatments, exactly as implemented in [30]. We tested four different population genetic variables: heterozygosity of S scaled by the divergence (D) between S and C populations (Hs/D), heterozygosity of S over heterozygosity of C (Hs/Hc), frequency difference between S and C for the major allele in C populations (MAF) and Fst value. Increasing allele frequency of a sequence variant due to selection is expected to decrease heterozygosity while increasing divergence (D), resulting in lower Hs/D values in selected regions. However, when selected alleles are rising to intermediate frequency (as during soft sweeps), genome regions may increase in heterozygosity and divergence under selection. We tested for this by comparing heterozygosity in the selection and control lines (Hs/Hc). Heterozygosity and divergence were defined as: H = (1 – Σover_all_i (pi2)), where pi is the frequency of the ith allele. D = (1 – Σover_all_i (fi × gi)), where fi and gi are the frequencies of the ith allele in the two samples compared. MAF, Fst and per-site allele frequencies were calculated as defined in the electronic supplementary material of [35]. Although some of these statistics may not be equally sensitive to all changes, the combination of these four statistics and their directions of change allow us to recognize the different forms of allelic changes.
Statistics were calculated per multi-allelic site and averaged across 1 kb segments. Likelihood scores were calculated across 100 kb windows using statistics calculated from 1 kb segments, as described in [30]. Significance of selected regions was accessed via permutation tests and resampling of the genetic statistic at 100 randomly selected 1 kb regions across the genome to calculate empirical likelihood scores. This bootstrapping revealed that depending on the genetic statistic being accessed, empirical likelihood scores exceeded 100 only 2–6% of the time. This score of 100 was uniformly selected as the threshold cut-off and 100 kb windows were classified as significant when scores exceeded 100.
For each of the four statistics, control lines were also compared to each other to account for the different effects of selection and drift. Density distributions of these statistics for selection against control and for control against control lines are clearly different (p < 1e−16), with the former having a larger variance. The comparison of distributions within replicated selection with the other selection lines and within replicated control with the other control lines shows no significance difference (p < 0.89). No genomic regions had a likelihood score of more than 24 in any of these comparisons (results not shown). Altogether, these results confirm the genomic differences between selection and control lines and the consistent and concerted changes occurring within selected and control lines.
3. Results
(a). Selection for increased parasitoid resistance
After five generations of artificial selection, all four selection lines showed consistent increases in resistance. The fraction of D. melanogaster larvae that were able to successfully complete encapsulation of a parasitoid egg increased from 20% in the base population to approximately 50% in all four selection lines (figure 1). Resistance ability was significantly higher in all selection lines than in their respective control lines, while there was no significant difference between the four biological replicates of the selection procedure (control versus selection: F1,66 = 22.3, p = 1.45 × 10⁻⁵; replicate lines nested within selection or control: F6,60 = 0.22, p = 0.97). The resistance in control lines did not differ from that in the base population.
Figure 1.
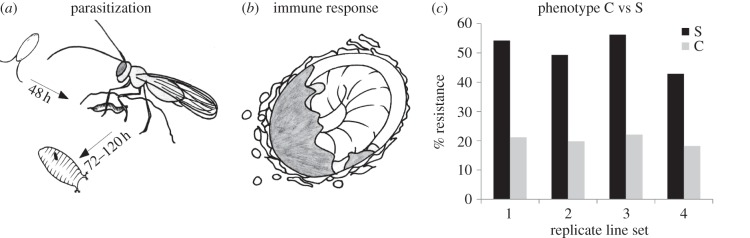
Difference in parasitoid resistance between the S and C lines. (a) Schematic view of Drosophila development under parasitization; (b) the encapsulation response, including recognition of the egg, recruitment of different haemocyte types and encapsulation and melanization of the egg; (c) the average resistance in the four selection and four control lines. Resistance is based on individual larval dissections and scored as the percentage of larvae that had fully encapsulated and melanised the entire parasitoid egg.
(b). Genomic signatures of selection
The eight DNA pools of 50 female flies from the four selection and control lines yielded a total of 142 million quality-filtered uniquely mapped reads (80%), resulting in 88× coverage across the 169 Mb genome. Mapping coverage varied across scaffolds, ranging from 12 to 62% of bases covered in heterochromatic scaffolds to 94–97% within the five large chromosome arms. When only considering the 127 Mb covered, coverage increased to 123× (see electronic supplementary material, table S1). We found 2 300 097 multi-allelic positions or ‘segregating sites’. This corresponds to approximately one segregating site per 55 base pairs in the covered genome (or approximately 181 positions per 10 kb)
Using these multi-allelic positions, we describe the genomic changes as a result of the selective sweep. To identify genomic regions with signatures of selection, we calculated heterozygosity, major allele frequency and Fst across 100 kb windows and used a likelihood score for observing extreme values. We identified a total of 23 genomic regions with signatures of selection, distributed across all five large chromosome arms (figure 2, top and second panels). These potentially ‘selected regions’ contain between 1 and 100 genes and vary in size up to 1200 kb (see electronic supplementary material, table S2). The selected regions together cover a total of 6900 kb, which correspond to approximately 3.6% of the total genome (or 4.8% of the covered genome) and contain a total of 482 genes. Although the Drosophila genome is one of the best annotated genomes, for 137 out of these 482 genes, apart from the gene prediction, there is no gene ontology (GO) annotation available at present on either the molecular function or the biological processes (see electronic supplementary material, table S2). Possibly, some of these un-annotated genes have immune-related function.
Figure 2.

Genome changes after selection for increased parasitoid resistance. Panel 1: Regions with signatures of selection across the genome (indicated in grey), based on different population genetic measures: heterozygosity divided by divergence, heterozygosity in selected/heterozygosity in control lines, major allele frequency difference (MAF) or Fst. The x-axis denotes the locations along the chromosomes, while the colours indicate the different chromosomes. The black lines are the measures averaged over 100 kb regions, while the dots are measures averaged over 1000 kb. Panel 2: A conceptual overview of the location of signatures of selection over the different chromosomes. Panel 3: The FDR-corrected p-values of individual segregating sites within and immediately flanking the 600 kb selected region on chromosome 2R. The grey block denotes the selected region. Panel 4: The p-values (not FDR-corrected) for the 600 kb selected region on chromosome 2R calculated per selection line individually.
(c). Genes potentially associated with increased parasitoid resistance
Among the 345 annotated genes in the selected regions, 91 were associated with pathways known to be implicated in immune responses (e.g. JAK/STAT, JNK, notch and the ran/ras pathway) or had an annotation that could be broadly linked to parasitoid defence, including GO terms such as immune response, stress response, cell death and apoptosis (see the electronic supplementary material, table S2). Defence-related genes included dnr1, dome, cdc42, CG14225, eip75B, amn, GNBP1 and GNBP2, which are involved in cellular or humoral immune responses. The gene cdc42 is additionally annotated in haemopoeisis and wound healing. The only gene present in a narrow region on 2R, jing, is also annotated in response to wounding. DCR-2 and AGO3 are involved in (ds)RNA silencing and defence responses to viruses. CadN, CadN2, jing, wrapper dome, cdc42, CG5085 and CG14213 are related to cell morphogenesis and cell differentiation processes. Ubqn, car and e(y)3 are involved in cellular pigmentation. We found no evidence for a significant enrichment of immune-related annotations in the genes that are in the selected regions compared with the rest of the genome (David Functional Annotation Tool [36]). Neither did we find enrichment when we checked specifically in the three largest selected regions (table 1). In contrast to expression studies, we would not necessarily expect over-representation of GO categories associated with the trait, as a selective sweep is expected to target one or a few genes in a genome region as well as affect the regions in LD with these targets. While selection may have an impact on positions physically linked to the target of selection, over-representation should only be expected when these genes in LD are part of the same biological processes and/or interaction networks.
Table 1.
Overview of the three main selected regions carrying a signature of selection, indicating the location of each selected region, the number of highly significant segregating sites and the genes associated with these segregating sites. Additional candidates for this region were either based on GO annotations or significantly differential expression in the microarray data related to parasitoid resistance [10,11]. The full overview of all regions is included as the electronic supplementary material, table S2.
| physical position |
SNP information |
annotation |
||||||||
|---|---|---|---|---|---|---|---|---|---|---|
| region | chromosome | left boundary | region size (kb) | number of genes in region | number of unannotated genes in region | number of significant SNPs in region (p < 0.01) | genes associated to significant SNP <0.01 (candidates) | genes with (defence) related annotation | genes associated with expression difference (attack) | genes associated with expression difference (C versus S) |
| 7 | 2R | 12 900 000 | 600 | 100 | 34 (34%) | 94 | Ark, RhoGEF2, GstS1, CG30456, CG17287, CG10950, CG18469, CG12699, mbl, tRNA:CR30232, Sip1, CG6568, CG30101, Prosalpha5, EDTP, mthl4, CG14478, CG6522, qkr54B, CG6520, veil, CG30103, CG4844, CG18431, ssp4, CG18432, Dcr-2, CG6484, lack, CG11423, CG42649, CG10936 | arka, fat-spondin, Spn53F, mbla, cnk, mthl4a, mthl3, CG10764, CG4853, cyp33, ns2, Rab4, Dcr-2a | — | robl, CG4847, Sip1a, CG14478a, CG6568a, mthl4a, fat-spondin, mthl3, Cda9 |
| 8 | 2R | 18 100 000 | 500 | 83 | 22 (26.51%) | 2 | mRpS29, ppa, robo | Rtf1, wrapper, rad50, dnr1, Cdk9, RYBP, roboa, Obp59a, 58b, 58c, 58d | CG4250b | CG4250b, Oatp58Dc, Mes4, rad50, CG4269, CG13510, CG30269, CG30273, CG42565, CG42566, CG5819, CG4752, Ugt58Fa |
| 22 | X | 19 400 000 | 400 | 66 | 7 (10.61%) | — | — | Prfx, car, Tap-1, CG14207, MKP-4, e(y)3, Sec6gamma, Ranbp21, CG14225, dome, Ubqn, CG14227, Mer, Cdc42, Bap, skpD, snkC, skpE, pico, amn, CG14213, CG14218 | RpS10bb, CG14225(et), dome | RpS10bb, CG14205, CG32529 |
aAssociated to a SNP (p < 0.01).
bIn both microarrays, associated to a SNP (p < 0.01).
To associate the selected regions to possible targets of selection, we tested frequency difference in all segregating sites between the S and C lines. Highly significant frequency changes either indicate targets of selection or are closely associated with one. We compared the frequencies of 2 300 097 segregating sites between the selection and control treatments (Fisher exact test, FDR-corrected p < 0.01) and identified 215 positions whose frequency had been significantly affected by the selection treatment (see electronic supplementary material, table S3). No alleles were swept to fixation between the pooled S and C treatments. These highly significant segregating (SS) sites are over-represented within the selected regions (hypergeometric test, p < 0.001), as 98 of these 215 sites fall within a selected region. The vast majority (93%) of these 98 significant segregating sites fall within a 600 kb region on chromosome 2R. The remaining significant segregating sites were located in selected regions on chromosomes 2L, 2R and 3L. Although multiple regions of the genome seem to be involved, there seems to be an especially large effect of this 600 kb region on chromosome 2R.
We identified 42 genes within the selected regions that contain one or several significant segregating sites within an exon, intron or in an intergenic region within proximity to these genes. We considered these 42 genes associated with segregating sites as the possible targets of selection, or ‘candidate genes’, within the selected regions (table 1). Several candidate genes were associated with a relatively high number of significant segregating sites, such as mbl (24 segregating sites), tRNA:CR30232 (11), CG10936 (10) and ssp4 (9). In eight candidate genes, a significant segregating site fell within an exon, in 15 genes one or more segregating sites were present within an intron and 19 candidate genes were associated with intergenic segregating sites. The genes mthl4 (G-protein-coupled receptor stress response), ark (apoptosis, cell death) and rhoGEF2 (cell morphogenis) all contain segregating sites in an exon and have relevant annotations to the trait. DCR-2 and lack are both associated with immunity and robo encodes a fibronectin/immunoglobulin-like protein and is involved in cell differentiation.
(d). Overlap with expression studies
We cross-referenced the genes underlying the selected regions with two microarray expression experiments related to resistance against A. tabida [10,11] (table 1; electronic supplementary material, table S2). One study [11] describes genes that significantly changed in expression in D. melanogaster across a 3-day time course after parasitoid attack by A. tabida. We find a total of five genes in the selected regions that differ in expression in response to parasitoid attack, of which CG14225 and dome are notable. Both dome and CG14225 are involved in the JAK/STAT cascade and in cellular immunity. CG14225 is a possible duplication of dome and is restricted to the Drosophila sublineage that has the ability to mount a parasitoid immune defence and may have been under positive selection [37].
The second microarray study [10] identified genes that changed in expression after selecting for increased parasitoid resistance using identical protocols and the same base population as this study. The expression study was performed on unparasitized D. melanogaster from egg to late second-instar stages. We identified 29 genes that overlap with the genes that changed expression after selection for increased parasitoid resistance, of which four genes (Sip1, CG14478, CG6568 and mthl4) are associated with a highly significant segregating site. An additional seven genes are associated with less significant segregating sites, which include fat-spondin (serine-type endopeptidase inhibitor) and mthl3 (G-protein-coupled receptor, stress response). Of the 29 overlapping genes, 22 are located on chromosome 2R in two selected regions (table 1). Two genes RpS10b and CG4250, present on chromosomes X and 2R, respectively, overlap with both of the microarray datasets. RpS10b (structural ribosome constituent) does not have an annotation directly connected to parasitoid resistance and its connection to our trait is unclear, but CG4250 (protein feature LPS-induced tumour necrosis factor alpha factor, no clear annotation) is found to be almost exclusively expressed in haemocytes [38]. As recognition, encapsulation and melanization of the parasitoid egg are largely mediated by haemocytes, future functional characterization of CG4250 may indicate a molecular function of this gene in the immune response. We find no significant overlap between our dataset and that of either expression study [10,11] (hypergeometric test, p > 0.1)
4. Discussion
We rapidly selected for increased parasitoid resistance over five generations, leading to an increase in successful encapsulation of the parasitoid egg from 20% in the four control lines to 40–50% in the four selected lines, similar to previous studies [10,12,14]. To analyse the impact of the fast and strong selection pressure on the genome, we sequenced the genomes of these eight lines and assessed the genomic regions carrying a signature of positive selection. Based on population genetic measures over a 100 kb genomic window, we identified several narrowly defined regions across all the major chromosomal arms that showed signatures of selection (figure 2, panels 1 and 2). Combining this information with the loci that changed, we identified putative targets of selection for increased resistance. Two regions on chromosome 2R scored high on measures of heterozygosity and divergence and contained a high number of significantly different segregating sites between the control and selection treatments. Moreover, they contain 24 genes with a defence-related annotation and 22 genes that changed expression after selection for parasitoid resistance [10]. No over-representation of GO categories was found. However, this would not be expected unless the region impacted by selection is enriched for genes with a related/shared annotation. While the strongest signal was in two selected regions on chromosome 2R, other genomic regions carrying a signature of selection strongly suggest that there may have been multiple targets of selection during the selection response.
A 600 kb selected region on chromosome 2R can be considered a region of major effect on parasitoid resistance. In this region, 100 genes are present, of which 32 can be associated with highly significant segregating sites and may therefore be considered possible targets of selection, or ‘candidate genes’ within this region. We do not expect all significant segregating sites in a selected region to be functionally related to the trait, nor that all segregating sites are targets of selection. Rather, during the selection process, variants associated with the targets of selection (for example through linkage) have been swept through hitchhiking processes. When testing each of the four selection lines separately against the pooled control, significantly changed segregating sites in this region are present in all replicates (figure 2, panel 4). This 600 kb region on 2R will be further investigated in future studies on both the selection lines and in natural populations that differ in parasitoid resistance.
Chromosome 2R was previously associated with loci conferring parasitoid resistance. Orr & Irving [39] crossed three European D. melanogaster strains with marker lines and showed that resistance ability segregated with the second chromosome. Studies on isofemale Drosophila lines also identified two loci on chromosome 2R that contain alleles conferring resistance against A. tabida (Rst(2)At) or another parasitoid, Leptopilina boulardi (Rst(2)Lb) [40]. The first was localized near the centromere at 2–51.3 and the second in a 100 kb region starting from 55E2 [40,41]. Neither of these locations overlaps with the selected regions we identified. Finally, chromosome 2R was significantly enriched for differentially expressed genes after selection for increased parasitoid resistance, using the same base population [10]. One cluster of differentially expressed genes on 2R in [10] overlaps with our 600 kb region, providing additional support that genes on chromosome 2R are involved in variation in parasitoid resistance. It also indicates that selection for increased resistance affected the regulatory control of genes in this region.
Even though immunity itself may function in complex ways, the genetics of differences in parasitoid immunity have been suggested to be simpler and under the control of one or few loci [42,43]. Although our data cannot conclusively establish either a single locus or a combination of genes conferring increased resistance, our results would argue for a suite of genes being involved. We find multiple selected regions, with 1–2 possibly of major effect on 2R, including a number of genes with high support as targets of selection (e.g. mbl, CG10936) and a number of genes found to also differ in expression. As we do not find the same ‘tabida resistance gene’ identified by Poirie et al. [40], it seems that several genes can be involved in the differences in resistance among populations, possibly enriched in 2R. In contrast to the isofemale studies, our study used outbred lines and replicated selection processes. We may therefore be more likely to pick up multiple alleles that in combination increase resistance. Moreover, some level of (successful) parasitoid defence is present in the control and base populations. Therefore, we do not compare ‘presence/absence’ of the trait but a more realistic gradient of variation. By re-sequencing pools of individuals per line rather than individuals, however, we cannot disentangle if and which combinations of co-occurring segregating sites may interact. It would be interesting to test whether the segregating sites we identified as under selection are co-selected.
Several studies so far have combined artificial selection and re-sequencing in D. melanogaster. These studies mostly employ selection on standing variation, which is the most representative for selection in natural populations of multicellular, sexually reproducing animals [44]. This contrasts with experimental evolution studies in bacterial and other unicellular model systems that often require an accumulation of novel mutations [21,45,46]. The traits that have been artificially selected in these Drosophila studies range from fairly simple (e.g. courtship song [47]) to complex (developmental time [28], lifespan [30], laboratory adaptation [48]). Using an experimental approach on this genetically tractable model system, we are gaining important insight into the genomic impact and constraints of adaptive evolution.
Generally, Drosophila seems to be able to respond strongly to selection from standing variation, even over a few generations, under strong selective pressure [47]. While the majority of published studies have assessed genomic effects after relatively many (up to 600) generations of selection [19,28–30], we selected for only five generations on a complex trait: immunity. Several of the previous studies estimated the size and number of gene regions affected by a selection sweep [19,29,30,47]. For example, Remolina et al. [30] found several localized regions affected by selection for lifespan, associated with one or a few favourable haplotypes that started at very low frequency in the base population. Turner & Miller [47] found large diffuse regions to be affected after 14 generations of selection for courtship song, with very few dramatic changes in allele frequency. The fast and strong selection pressure we exerted was associated with a fairly large number of highly localized regions, across all the chromosomes, of which one specific region was best supported. The number of regions we identified indicates that a fast selection process can still be associated with a response in various specific genomic areas, rather than depleting variation over a large region of the genome. Similar to studies that selected for many generations, our selection response showed genome-wide effects with relatively narrow selected regions. This is in contrast with the general assumption that a fast response to selection leads to fixation of a small number of major effect alleles. This indicates that the observation that selection can impact comparatively small stretches of genome is not limited to long selection times.
An important determinant of selected region size may be the size of linkage blocks, which in turn depends on the population size and the amount of recombination in the laboratory [49]. Population size therefore is an important consideration in selection experiments, as it influences the amount of standing genetic variation available for selection to act upon, increases the scope for recombination and the rise of favourable allele combinations and limits the confounding effects of drift. As the populations in this study were sampled in 1995 and kept in large numbers until selection commenced in 2009, recombination occurred for approximately 100 generations providing optimal conditions for small linkage blocks. In natural situations, the scope for recombination in D. melanogaster populations is high owing to large population sizes and fast generation times, and LD in this species tends to decay fast (in the range of a few hundred basepairs) [50]. Moreover, no alleles were swept to fixation and variability in segregating sites frequency persisted within the selected regions, indicating that minimum population size seems to have been large enough to avoid severe bottlenecks. By using replicate selection events, we also greatly reduced the impact of drift in our analysis. Only regions that carried signatures of selection in multiple lines passed our significance thresholds. An alternative determinant for the size of selected regions could be naturally occurring chromosomal inversions that may exist in our base population, which could be swept through the population when they harbour a target of selection.
Not all features within a selected region will show the change of allele frequency. Rather, which segregating sites show such a change must depend on initial ‘chance sampling LD’ [51]. Our design minimizes sampling LD, as we have never reduced the large size of the population except during selection, and drift during selection is accounted for through replication. Accordingly, our design is expected to minimize the number of chance associations. We consider the information obtained from individual segregating sites to be most informative when combined with heterozygosity changes over genomic windows. The individual segregating sites are significantly clustered in the selected regions (i.e. less than 5% of the genome). When considering individual segregating sites, we are pleased to see relatively few segregating sites showing changes in allele frequency (see for comparison e.g. [47,48]). As we focus on a smaller set of segregating sites (at a more conservative significance threshold), a larger proportion might be causally associated with selection, rather than through ‘sampling LD’.
Under hard selective sweeps over many generations where alleles are swept to (almost) fixation, selected areas tend to be associated with lower heterozygosity [28,30]. Under soft selective sweeps, selected alleles increase in frequency from relatively low initial frequencies, increasing heterozygosity. We combine both patterns of heterozygosity as a diagnostic measure with changes in allele frequency and Fst values. The pattern that no alleles are swept to fixation seems to be consistent between the studies published so far, including ours, and indicates that soft (incomplete) sweeps are common in genomic responses to selection. This is an interesting observation to make and may indicate that hard sweeps are rare in these kind of experiments and that genetic drift over longer time periods assists the fixation of beneficial alleles. Incomplete sweeps may be relatively common in nature as well, especially under selection at short timescales, rarely fixating loci and maintaining genetic variation. Additionally, recessive deleterious alleles may, through inbreeding depression, further restrict fixation by constraining homozygosity in localized regions [44].
Phenotypic change in parasitoid resistance tends to level off after only a few generations of selection [13,14] and subsequently persists without further selection (for more than 20 generations; K. M. Jalvingh 2014, unpublished data). It seems unlikely that important genetic variation in the selection lines has been exhausted after such a limited number of generations of selection. Heterozygote advantage and/or inbreeding depression may in part limit the extent to which advantageous allele combinations can increase in frequency. It is also possible that epistasis, pleiotropy, strong physiological and/or genetic trade-offs limit maximization of resistance and the trait is selected to the optimum rather than the maximum. The identified candidate genes have a wide range in GO annotations, which may indicate ample opportunity for pleiotropy.
The immune response against parasitoids in Drosophila is haemocyte mediated. Selection lines show significantly increased densities of blood cells in the haemolymph compared with control lines ([10,12]; K. M. Jalvingh 2014, unpublished data). Within and among-species differences in haemocyte density were also associated with encapsulation ability [6,52]. Both cell proliferation and differentiation may play an important role in the regulation of a successful immune response [9,15,17]. The regions we identified included 91 genes that are either linked to immune responses or to cell differentiation. We hypothesize that variation in genes associated with (haemocyte) cell differentiation may well be a target of selection in natural populations.
The regions we found to be affected by selection in a single population are not necessarily similarly affected among populations. Population and species-specific properties may differentially shape selection responses in complex traits. Moreover, genetic changes may affect whole regulatory cascades, with limited scope for change in ‘key’ genes in the cascade. The first step toward testing whether selection for parasitoid immunity in one population has predictive value for other populations will be to assess whether similar genetic differences can be associated with among-population variation in parasitoid defence. Furthermore, functional characterization of the candidate genes is an essential next step to assess whether these genes can cause genetic variation in resistance.
In this study, we found new insights into how fast evolutionary responses can impact the genome, having detected selection on multiple genome regions and no fixation of individual alleles. Experimental evolution in a laboratory setting is an idealized situation in which to study adaptation, avoiding or minimizing migration, stochasticity and forcing discrete generations. In the case of parasitoid defence, alternative adaptations may be selected under increased parasitoid pressure in nature (e.g. increased developmental speed or behavioural avoidance). Community assembly (including alternative hosts, parasites, pathogens and beneficial mutualists) may conceivably mitigate population bottlenecks and provide alternative response trajectories. Similar studies on natural Drosophila populations and other model systems will be important to assess how these factors influence selective sweeps. Currently, genomic studies on naturally replicate selection events, in for example Daphnia [27], three-spined sticklebacks [53] and plants [25,54], are providing complementary insights into how populations are responding to selection at the whole-genome level.
Acknowledgements
We thank Kuke Bijlsma, Louis van de Zande, Joyce Kao, Laura Salazar-Jaramillo, Sylvia Gerritsma, Òscar Vilaplana, Maren Friesen, Michael Mesa and Joe Dunham for valuable discussions, help and/or suggestions and three anonymous reviewers for their comments on the manuscript.
Data accessibility
The sequencing data are available at NCBI under the BioProject PRJNA170455.
Funding statement
This work was supported by a VIDI grant no. 864.08.008 to B.W. of The Netherlands Organisation for Scientific Research (NWO) and a travel grant of the Schure-Beijerinck-Popping Fund of the KNAW.
References
- 1.Kraaijeveld AR, Ferrari J, Godfray HCJ. 2002. Costs of resistance in insect–parasite and insect–parasitoid interactions. Parasitology 125, S71–S82 (doi:10.1017/S0031182002001750) [DOI] [PubMed] [Google Scholar]
- 2.Schmid-Hempel P. 2005. Evolutionary ecology of insect immune defenses. Annu. Rev. Entomol. 50, 529–551 (doi:10.1146/annurev.ento.50.071803.130420) [DOI] [PubMed] [Google Scholar]
- 3.McKean KA, Yourth CP, Lazzaro BP, Clark AG. 2008. The evolutionary costs of immunological maintenance and deployment. BMC Evol. Biol. 8, 76 (doi:10.1186/1471-2148-8-76) [DOI] [PMC free article] [PubMed] [Google Scholar]
- 4.Lazzaro BP, Little TJ. 2009. Immunity in a variable world. Phil. Trans. R. Soc. B 364, 15–26 (doi:10.1098/rstb.2008.0141) [DOI] [PMC free article] [PubMed] [Google Scholar]
- 5.Prevost G. (eds) 2009. Advances in parasitology volume 70: parasitoids of Drosophila. New York, NY: Academic Press; [DOI] [PubMed] [Google Scholar]
- 6.Prévost G, Eslin P. 1998. Hemocyte load and immune resistance to Asobara tabida are correlated in species of the Drosophila melanogaster subgroup. J. Insect Physiol. 44, 807–816 (doi:10.1016/S0022-1910(98)00013-4) [DOI] [PubMed] [Google Scholar]
- 7.Schlenke TA, Morales J, Govind S, Clark AG. 2007. Contrasting infection strategies in generalist and specialist wasp parasitoids of Drosophila melanogaster. PLoS Pathog. 3, 1486–1501 (doi:10.1371/journal.ppat.0030158) [DOI] [PMC free article] [PubMed] [Google Scholar]
- 8.Kraaijeveld AR, Godfray HCJ. 1999. Geographic patterns in the evolution of resistance and virulence in Drosophila and its parasitoids. Am. Nat. 153, S61–S74 (doi:10.1086/303212) [DOI] [PubMed] [Google Scholar]
- 9.Gerritsma S, Haan AD, Zande LV, Wertheim B. 2013. Natural variation in differentiated hemocytes is related to parasitoid resistance in Drosophila melanogaster. J. Insect Physiol. 59, 148–158 (doi:10.1016/j.jinsphys.2012.09.017) [DOI] [PubMed] [Google Scholar]
- 10.Wertheim B, Kraaijeveld AR, Hopkins MG, Walther Boer M, Godfray HCJ. 2011. Functional genomics of the evolution of increased resistance to parasitism in Drosophila. Mol. Ecol. 20, 932–949 (doi:10.1111/j.1365-294X.2010.04911.x) [DOI] [PubMed] [Google Scholar]
- 11.Wertheim B, Kraaijeveld AR, Schuster E, Blanc E, Hopkins M, Pletcher SD, Strand MR, Partridge L, Godfray HCJ. 2005. Genome-wide gene expression in response to parasitoid attack in Drosophila. Genome Biol. 6, R94 (doi:10.1186/gb-2005-6-11-r94) [DOI] [PMC free article] [PubMed] [Google Scholar]
- 12.Kraaijeveld AR, Limentani EC, Godfray HC. 2001. Basis of the trade-off between parasitoid resistance and larval competitive ability in Drosophila melanogaster. Proc. R. Soc. Lond. B 268, 259–261 (doi:10.1098/rspb.2000.1354) [DOI] [PMC free article] [PubMed] [Google Scholar]
- 13.Fellowes MD, Kraaijeveld AR, Godfray HC. 1998. Trade-off associated with selection for increased ability to resist parasitoid attack in Drosophila melanogaster. Proc. R. Soc. Lond. B 265, 1553–1558 (doi:10.1098/rspb.1998.0471) [DOI] [PMC free article] [PubMed] [Google Scholar]
- 14.Kraaijeveld AR, Godfray HCJ. 1997. Trade-off between parasitoid resistance and larval competitive ability in Drosophila melanogaster. Nature 389, 278–280 (doi:10.1038/38483) [DOI] [PubMed] [Google Scholar]
- 15.Lemaitre B, Hoffmann J. 2007. The host defense of Drosophila melanogaster. Annu. Rev. Immunol. 25, 697–743 (doi:10.1146/annurev.immunol.25.022106.141615) [DOI] [PubMed] [Google Scholar]
- 16.Hultmark D. 2003. Drosophila immunity: paths and patterns. Curr. Opin. Immunol. 15, 12–19 (doi:10.1016/S0952-7915(02)00005-5) [DOI] [PubMed] [Google Scholar]
- 17.Williams MJ. 2007. Drosophila hemopoiesis and cellular immunity. J. Immunol. 178, 4711–4716 [DOI] [PubMed] [Google Scholar]
- 18.Stapley J, et al. 2010. Adaptation genomics: the next generation. Trends Ecol. Evol. 25, 705–712 (doi:10.1016/j.tree.2010.09.002) [DOI] [PubMed] [Google Scholar]
- 19.Turner TL, Stewart AD, Fields AT, Rice WR, Tarone AM. 2011. Population-based resequencing of experimentally evolved populations reveals the genetic basis of body size variation in Drosophila melanogaster. PLoS Genet. 7, e1001336 (doi:10.1371/journal.pgen.1001336) [DOI] [PMC free article] [PubMed] [Google Scholar]
- 20.Barrick JE, Yu DS, Yoon SH, Jeong H, Oh TK, Schneider D, Lenski RE, Kim JF. 2009. Genome evolution and adaptation in a long-term experiment with Escherichia coli. Nature 461, 1243–1247 (doi:10.1038/nature08480) [DOI] [PubMed] [Google Scholar]
- 21.Hunt P, et al. 2010. Experimental evolution, genetic analysis and genome re-sequencing reveal the mutation conferring artemisinin resistance in an isogenic lineage of malaria parasites. BMC Genomics 11, 499 (doi:10.1186/1471-2164-11-499) [DOI] [PMC free article] [PubMed] [Google Scholar]
- 22.Flori L, Fritz S, Jaffrézic F, Boussaha M, Gut I, Heath S, Foulley J-L, Gautier M. 2009. The genome response to artificial selection: a case study in dairy cattle. PLoS ONE 4, e6595 (doi:10.1371/journal.pone.0006595) [DOI] [PMC free article] [PubMed] [Google Scholar]
- 23.Araya CL, Payen C, Dunham MJ, Fields S. 2010. Whole-genome sequencing of a laboratory-evolved yeast strain. BMC Genomics 11, 88 (doi:10.1186/1471-2164-11-88) [DOI] [PMC free article] [PubMed] [Google Scholar]
- 24.Parts L, et al. 2011. Revealing the genetic structure of a trait by sequencing a population under selection. Genome Res. 21, 1131–1138 (doi:10.1101/gr.116731.110) [DOI] [PMC free article] [PubMed] [Google Scholar]
- 25.Turner TL, Bourne EC, Von Wettberg EJ, Hu TT, Nuzhdin SV. 2010. Population resequencing reveals local adaptation of Arabidopsis lyrata to serpentine soils. Nat. Genet. 42, 260–263 (doi:10.1038/ng.515) [DOI] [PubMed] [Google Scholar]
- 26.Tollrian R, Leese F. 2010. Ecological genomics: steps towards unraveling the genetic basis of inducible defenses in Daphnia. BMC Biol. 8, 51 (doi:10.1186/1741-7007-8-51) [DOI] [PMC free article] [PubMed] [Google Scholar]
- 27.Orsini L, Spanier KI, De Meester L. 2012. Genomic signature of natural and anthropogenic stress in wild populations of the waterflea Daphnia magna: validation in space, time and experimental evolution. Mol. Ecol. 21, 2160–2175 (doi:10.1111/j.1365-294X.2011.05429.x) [DOI] [PubMed] [Google Scholar]
- 28.Burke MK, Dunham JP, Shahrestani P, Thornton KR, Rose MR, Long AD. 2010. Genome-wide analysis of a long-term evolution experiment with Drosophila. Nature 467, 587–590 (doi:10.1038/nature09352) [DOI] [PubMed] [Google Scholar]
- 29.Zhou D, et al. 2011. Experimental selection of hypoxia-tolerant Drosophila melanogaster. Proc. Natl Acad. Sci. USA 108, 2349–2354 (doi:10.1073/pnas.1010643108) [DOI] [PMC free article] [PubMed] [Google Scholar]
- 30.Remolina SC, Chang PL, Leips J, Nuzhdin SV, Hughes KA. 2012. Genomic basis of aging and life-history evolution in Drosophila melanogaster. Evolution 66, 3390–3403 (doi:10.5061/dryad.94pv0) [DOI] [PMC free article] [PubMed] [Google Scholar]
- 31.Mortazavi A, Williams BA, McCue K, Schaeffer L, Wold B. 2008. Mapping and quantifying mammalian transcriptomes by RNA-Seq. Nat. Methods 5, 621–628 (doi:10.1038/nmeth.1226) [DOI] [PubMed] [Google Scholar]
- 32.Li H, Durbin R. 2009. Fast and accurate short read alignment with Burrows–Wheeler transform. Bioinformatics 25, 1754–1760 (doi:10.1093/bioinformatics/btp324) [DOI] [PMC free article] [PubMed] [Google Scholar]
- 33.McKenna A, et al. 2010. The genome analysis toolkit: a MapReduce framework for analyzing next-generation DNA sequencing data. Genome Res. 20, 1297–1303 (doi:10.1101/gr.107524.110) [DOI] [PMC free article] [PubMed] [Google Scholar]
- 34.DePristo MA, et al. 2011. A framework for variation discovery and genotyping using next-generation DNA sequencing data. Nat. Genet. 43, 491–498 (doi:10.1038/ng.806) [DOI] [PMC free article] [PubMed] [Google Scholar]
- 35.Yi X, et al. 2010. Sequencing of 50 human exomes reveals adaptation to high altitude. Science 329, 75–78 (doi:10.1126/science.1190371) [DOI] [PMC free article] [PubMed] [Google Scholar]
- 36.Dennis G, Sherman BT, Hosack DA, Yang J, Gao W, Lane HC, Lempicki RA. 2003. DAVID: database for annotation, visualization and integrated discovery. Genome Biol. 4, P3 (doi:10.1186/gb-2003-4-5-p3) [PubMed] [Google Scholar]
- 37.Salazar-Jaramillo L, Paspati A, Zande L, Van D, Vermeulen CJ, Schwander T, Wertheim B. 2014. Genome changes associated with the evolution of the cellular immune response in Drosophila species. Genome Biol. Evol. (doi:10.1093/gbe/evu012) [DOI] [PMC free article] [PubMed] [Google Scholar]
- 38.Irving P, Ubeda J-M, Doucet D, Troxler L, Lagueux M, Zachary D, Hoffmann JA, Hetru C, Meister M. 2005. New insights into Drosophila larval haemocyte functions through genome-wide analysis. Cell. Microbiol. 7, 335–350 (doi:10.1111/j.1462-5822.2004.00462.x) [DOI] [PubMed] [Google Scholar]
- 39.Orr HA, Irving S. 1997. The genetics of adaptation: the genetic basis of resistance to wasp parasitism in Drosophila melanogaster. Evolution 51, 1877–1885 (doi:10.2307/2411009) [DOI] [PubMed] [Google Scholar]
- 40.Poirie M, Frey F, Hita M, Huguet E, Lemeunier F, Periquet G, Carton Y. 2000. Drosophila resistance genes to parasitoids: chromosomal location and linkage analysis. Proc. R. Soc. Lond. B 267, 1417–1421 (doi:10.1098/rspb.2000.1158) [DOI] [PMC free article] [PubMed] [Google Scholar]
- 41.Hita M, Espagne E, Lemeunier F, Pascual L, Carton Y, Periquet G, Poirie M. 2006. Mapping candidate genes for Drosophila melanogaster resistance to the parasitoid wasp Leptopilina boulardi. Genet. Res. 88, 81–91 (doi:10.1017/S001667230600841X) [DOI] [PubMed] [Google Scholar]
- 42.Carton Y, Nappi AJ, Poirie M. 2005. Genetics of anti-parasite resistance in invertebrates. Dev. Comp. Immunol. 29, 9–32 (doi:10.1016/j.dci.2004.05.004) [DOI] [PubMed] [Google Scholar]
- 43.Dupas S, Carton Y, Poiriè M. 2003. Genetic dimension of the coevolution of virulence–resistance in Drosophila–parasitoid wasp relationships. Heredity 90, 84–89 (doi:10.1038/sj.hdy.6800182) [DOI] [PubMed] [Google Scholar]
- 44.Bijlsma R, Loeschcke V. 2012. Genetic erosion impedes adaptive responses to stressful environments. Evol. Appl. 5, 117–129 (doi:10.1111/j.1752-4571.2011.00214.x) [DOI] [PMC free article] [PubMed] [Google Scholar]
- 45.Beaumont HJE, Gallie J, Kost C, Ferguson GC, Rainey PB. 2009. Experimental evolution of bet hedging. Nature 462, 90–93 (doi:10.1038/nature08504) [DOI] [PubMed] [Google Scholar]
- 46.Blount ZD, Barrick JE, Davidson CJ, Lenski RE. 2012. Genomic analysis of a key innovation in an experimental Escherichia coli population. Nature 489, 513–518 (doi:10.1038/nature11514) [DOI] [PMC free article] [PubMed] [Google Scholar]
- 47.Turner TL, Miller PM. 2012. Investigating natural variation in Drosophila courtship song by the evolve and resequence approach. Genetics 191, 633–642 (doi:10.1534/genetics.112.139337) [DOI] [PMC free article] [PubMed] [Google Scholar]
- 48.Orozco-terWengel P, Kapun M, Nolte V, Kofler R, Flatt T, Schlötterer C. 2012. Adaptation of Drosophila to a novel laboratory environment reveals temporally heterogeneous trajectories of selected alleles. Mol. Ecol. 21, 4931–4941 (doi:10.1111/j.1365-294X.2012.05673.x) [DOI] [PMC free article] [PubMed] [Google Scholar]
- 49.Nuzhdin SV, Harshman LG, Zhou M, Harmon K. 2007. Genome-enabled hitchhiking mapping identifies QTLs for stress resistance in natural Drosophila. Heredity 99, 313–321 (doi:10.1038/sj.hdy.6801003) [DOI] [PubMed] [Google Scholar]
- 50.Mackay TFC. 2004. The genetic architecture of quantitative traits: lessons from Drosophila. Curr. Opin. Genet. Dev. 14, 253–257 (doi:10.1016/j.gde.2004.04.003) [DOI] [PubMed] [Google Scholar]
- 51.Nuzhdin SV, Turner TL. 2013. Promises and limitations of hitchhiking mapping. Curr. Opin. Genet. Dev. 23, 694–699 (doi:10.1016/j.gde.2013.10.002) [DOI] [PMC free article] [PubMed] [Google Scholar]
- 52.Eslin P, Prevost G. 1996. Variation in Drosophila concentration of haemocytes associated with different ability to encapsulate Asobara tabida larval parasitoid. J. Insect Physiol. 42, 549–555 (doi:10.1016/0022-1910(95)00134-4) [Google Scholar]
- 53.Jones FC, et al. 2012. The genomic basis of adaptive evolution in threespine sticklebacks. Nature 484, 55–61 (doi:10.1038/nature10944) [DOI] [PMC free article] [PubMed] [Google Scholar]
- 54.Friesen ML, Cordeiro MA, Penmetsa RV, Badri M, Huguet T, Aouani ME, Cook DR, Nuzhdin SV. 2010. Population genomic analysis of Tunisian Medicago truncatula reveals candidates for local adaptation. Plant J. 63, 623–635 (doi:10.1111/j.1365-313X.2010.04267.x) [DOI] [PubMed] [Google Scholar]
Associated Data
This section collects any data citations, data availability statements, or supplementary materials included in this article.
Data Availability Statement
The sequencing data are available at NCBI under the BioProject PRJNA170455.