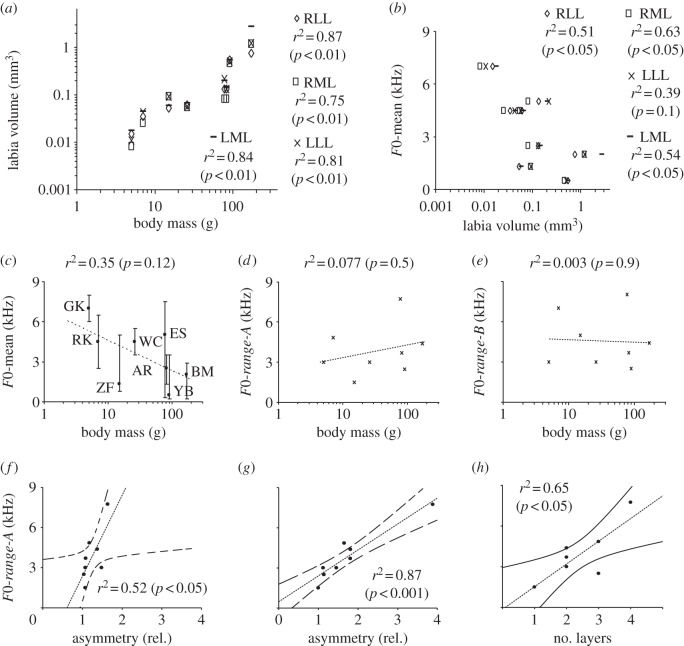
Figure 3.
Labial volume increases with increasing body mass (a), and can explain, in part, F0-mean of song (b). Regression models are presented in electronic supplementary material, table S4. Body mass does not explain more than 35% of the variation in the means of the F0-mean of song (c), dots are mean F0 and bars indicate the range to the minimum and maximum F0) and does not show a strong relationship with the F0-ranges of song in the eight species (d,e). Species abbreviations in c as in figure 1c. The relationships between F0-range-A and F0-range-B and labial volumes were not significant (see electronic supplementary material, table S4). (f,g) The degree of labial asymmetry (expressed as x-fold difference in area at the mid-syrinx level) is positively correlated with the F0-range-A in the songs of the eight species. (h) The number of distinct layers in the extracellular matrix of the medial labia is positively correlated with the F0-range-A but not F0-range-B of songs (see electronic supplementary material, table S4). The relationships between F0-mean and asymmetry or number of layers were not significant (see electronic supplementary material, table S4).

