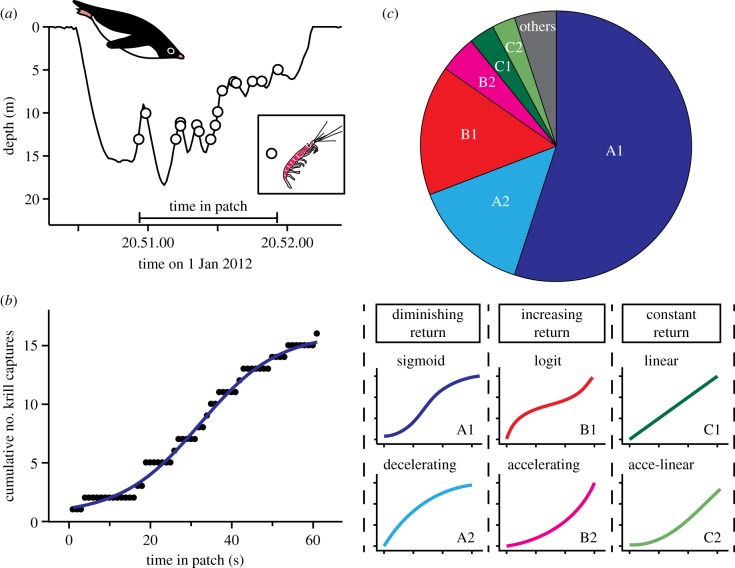
Figure 3.
Gain function analyses. (a) Example of a time-series depth record with the timings of krill capture events (open circles) during a dive from an Adélie penguin. Time in patch (horizontal bar) represents the time from the first krill capture to the last krill capture. (b) The cumulative numbers of krill captures plotted against time in patch, called gain function, of the dive in (a). A sigmoid curve (blue) was the most parsimonious model to express its shape in this case. (c) The proportions of gain functions (n = 263 dives from 22 birds), each of which is categorized by the shape at the end of the fitted model as ‘diminishing return’ (blue and light blue), ‘increasing return’ (red and pink), ‘constant return’ (green and light green) or ‘others’ (grey).

