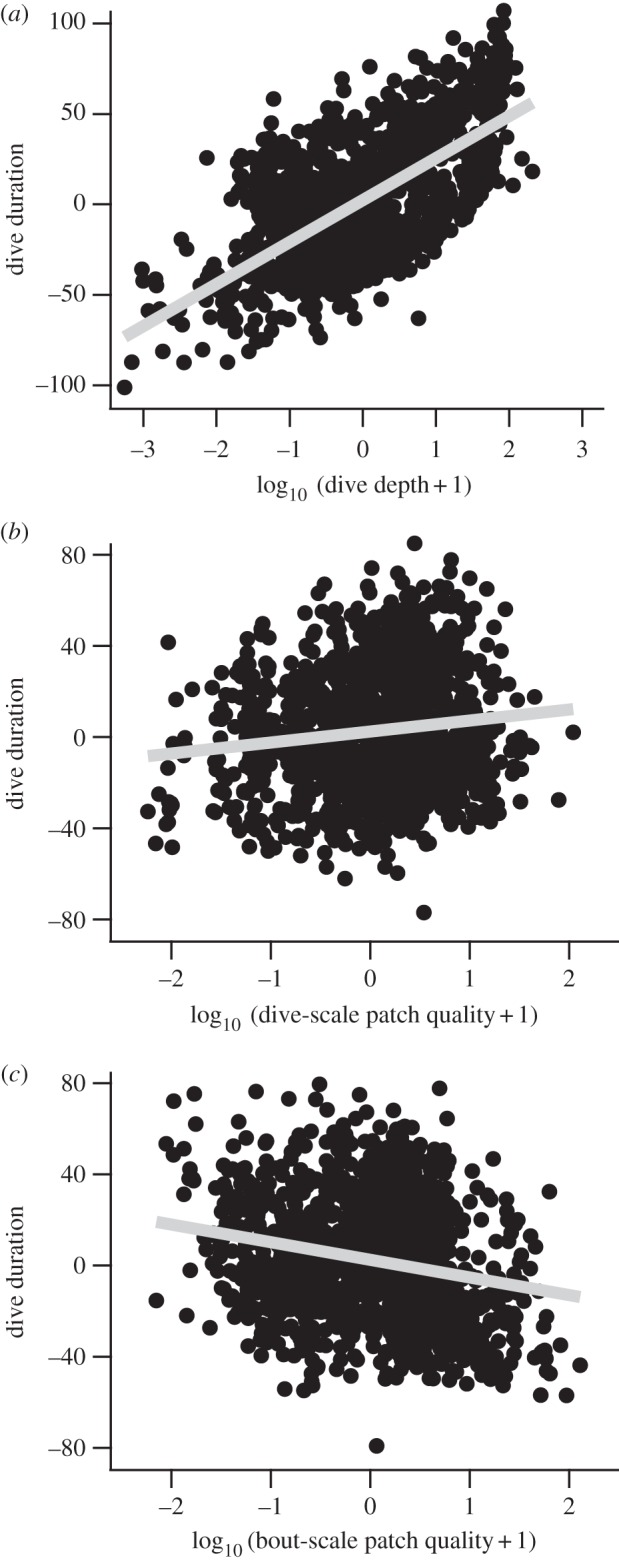
Figure 4.

Partial regression plots (i.e. the relationship between the response variable and a predictor, with the other predictors held constant [20]) from a linear mixed model (dive duration = dive depth + dive-scale patch quality + bout-scale patch quality) with bird ID as a random factor. For example, the x-axis in (a) is the residuals from a linear mixed model of dive depth against the other predators. The y-axis in (a) is the residuals from a linear mixed model of dive duration against all predictors excluding dive depth. Grey lines represent least-squares regression lines. All predictors were log-transformed and then standardized to have a mean of zero and standard deviation of 1.
