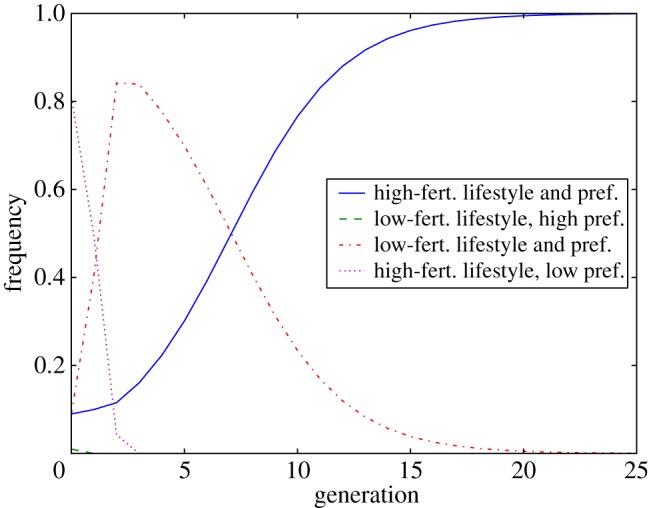
Figure 1.

Relative frequencies of PHH (blue, solid), PLH (green, dashed), PHL (purple, dotted) and PLL (red, dot-dashed) over time, after the manifestation of a new low-fertility lifestyle (model 1). We use the following initial values at t = 0: PHH(0) = 0.09, PLH(0) = 0.01, PHL(0) = 0.81 and PLL(0) = 0.09. The code to produce this figure can be found in electronic supplementary material, appendix B. (Online version in colour.)
