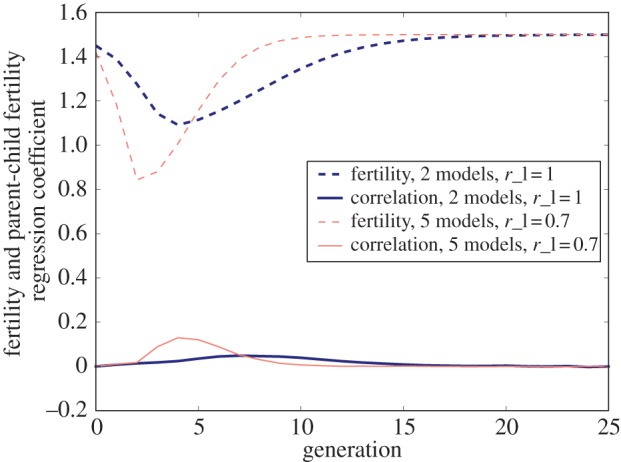
Figure 2.

Fertility and fertility correlations over time after the manifestation of a new low-fertility lifestyle (model 1). Dashed lines show fertility, solid lines show observed fertility correlations. The code to produce this figure can be found in electronic supplementary material, appendix B. (Online version in colour.)
