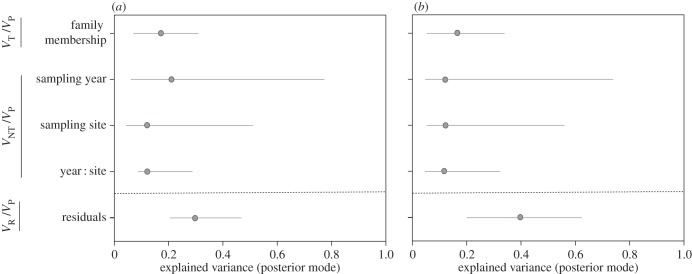
Figure 2.
Proportion of phenotypic variance explained by transmitted (VT/VP) and non-transmitted factors (VNT/VP) on (a) resistance and (b) tolerance to the ectoparasite Tracheliastes polycolpus. Proportions of explained variance were obtained from univariate animal models. The proportions of unexplained variance (VR/VP) are also displayed. In each plot, we represented the posterior mode of each variable (dots) and the 95% CI for this effect (horizontal bars). See details in the electronic supplementary material, table S3.

