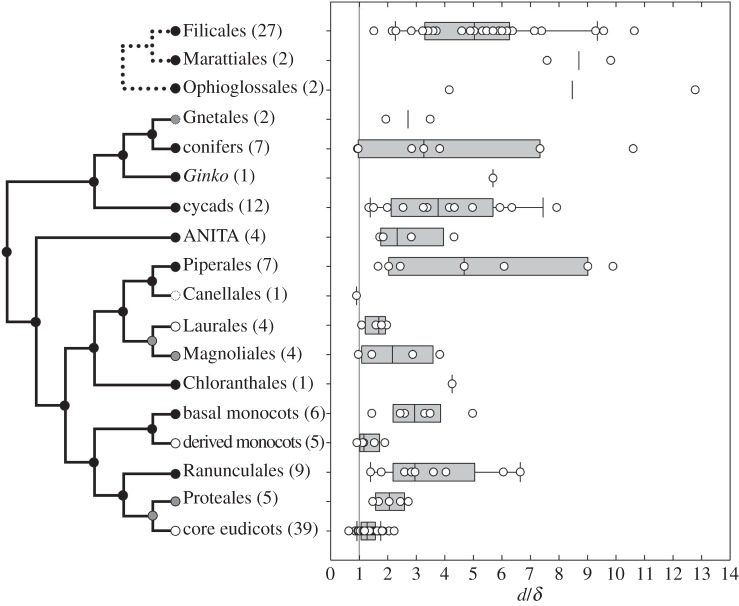
Figure 3.
Box and whisker graph of the phylogenetic distribution of d/δ ratios across the extant vascular plants, including separate evolutions of laminate leaves in seed plants and ferns. Early branching lineages of flowering plants are parsed out to highlight that the most parsimonious interpretation is that well-optimized leaves arose multiple times in different angiosperm lineages. Each nested lineage is labelled according to composition: black circles indicate lineages that include poorly optimized taxa, grey circles indicate lineages that maintain at least moderate optimization (d/δ < 4 for all individuals sampled), white circles indicate lineages that exclusively maintain high degrees of optimization (d/δ < 2.5 for all individuals sampled). Dashed circles indicate lineages that show some degree of optimization, but with poor sampling. Line represents the optimal d/δ ratio of 1 : 1. (Online version in colour.)

