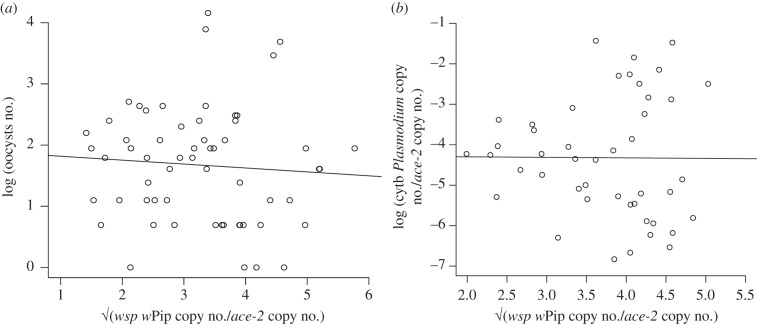
Figure 4.
Correlation between the density of Wolbachia and the intensity of Plasmodium infection at the (a) oocyst and (b) sporozoite stages (7–8 days and 14 days post blood meal, respectively). Both Wolbachia and Plasmodium densities were Box-Cox transformed to linearize the data for the graphic representation.

